


記一次 1000+每秒 UPDATE 引發的 Redo 風暴:AWR 定位 log file switch (checkpoint incomplete) 并落地解決

一、問題現象
12 月 8 日上午 11 點多,監控告警提示生產數據庫磁盤使用率超過 90%。初步判斷:磁盤使用突增,需要關注數據庫整體負載與日志增長情況。
二、問題排查
2.1 操作系統磁盤空間
查看 OS 空間與 Oracle 目錄占用,發現歸檔/恢復區相關目錄增長較快(fast_recovery_area 約 43G)。
[root@md-db-out ~]# df -h
Filesystem                   Size  Used Avail Use% Mounted on
/dev/mapper/vg_root-lv_root  461G  399G   39G  92% /
tmpfs                         32G  160K   32G   1% /dev/shm
/dev/sda1                    485M   39M  421M   9% /boot
[root@md-db-out ~]# su - oracle
[oracle@md-db-out ~]$ cd /u01/app/oracle/
[oracle@md-db-out oracle]$ du -h --max-depth=1
4.0K    ./checkpoints
55G     ./diag
4.6G    ./admin
70G     ./oradata
43G     ./fast_recovery_area
1.8M    ./cfgtoollogs
4.4G    ./product
177G    .
[oracle@md-db-out oracle]$
雖然oradata目錄不小但故障前沒有添加過表空間數據文件,所以這次告警更像是“歸檔/恢復區增長過快”觸發
2.2 歸檔日志切換頻率異常
歸檔日志增長過快后,進一步統計日志切換頻率,發現上午 9 點開始切換次數從 11 次 → 755 次(提升近 68 倍)。
[oracle@md-db-out oracle]$ sqlplus / as sysdba

SQL*Plus: Release 11.2.0.4.0 Production on Mon Dec 8 11:27:01 2025

Copyright (c) 1982, 2013, Oracle.  All rights reserved.


Connected to:
Oracle Database 11g Enterprise Edition Release 11.2.0.4.0 - 64bit Production
With the Partitioning, OLAP, Data Mining and Real Application Testing options

SQL> set lines 300
SQL> column h0 format 999
column h1 format 999
column h2 format 999
column h3 format 999
column h4 format 999
column h5 format 999
column h6 format 999
column h7 format 999
column h8 format 999
column h9 format 999
column h10 format 999
column h11 format 999
column h12 format 999
column h13 format 999
column h14 format 999
column h15 format 999
column h16 format 999
column h17 format 999
column h18 format 999
column h19 format 999
column h20 format 999
column h21 format 999
column h22 format 999
column h23 format 999
column avg format 999.99
column day format a6

SELECT TRUNC (first_time) "Date", TO_CHAR (first_time, 'Dy') "Day", COUNT (1) "Total",
SUM (DECODE (TO_CHAR (first_time, 'hh24'), '00', 1, 0)) h0,
SUM (DECODE (TO_CHAR (first_time, 'hh24'), '01', 1, 0)) "h1",
SUM (DECODE (TO_CHAR (first_time, 'hh24'), '02', 1, 0)) "h2",
SUM (DECODE (TO_CHAR (first_time, 'hh24'), '03', 1, 0)) "h3",
SUM (DECODE (TO_CHAR (first_time, 'hh24'), '04', 1, 0)) "h4",
SUM (DECODE (TO_CHAR (first_time, 'hh24'), '05', 1, 0)) "h5",
SUM (DECODE (TO_CHAR (first_time, 'hh24'), '06', 1, 0)) "h6",
SUM (DECODE (TO_CHAR (first_time, 'hh24'), '07', 1, 0)) "h7",
SUM (DECODE (TO_CHAR (first_time, 'hh24'), '08', 1, 0)) "h8",
SUM (DECODE (TO_CHAR (first_time, 'hh24'), '09', 1, 0)) "h9",
SUM (DECODE (TO_CHAR (first_time, 'hh24'), '10', 1, 0)) "h10",
SUM (DECODE (TO_CHAR (first_time, 'hh24'), '11', 1, 0)) "h11",
SUM (DECODE (TO_CHAR (first_time, 'hh24'), '12', 1, 0)) "h12",
SUM (DECODE (TO_CHAR (first_time, 'hh24'), '13', 1, 0)) "h13",
SUM (DECODE (TO_CHAR (first_time, 'hh24'), '14', 1, 0)) "h14",
SUM (DECODE (TO_CHAR (first_time, 'hh24'), '15', 1, 0)) "h15",
SUM (DECODE (TO_CHAR (first_time, 'hh24'), '16', 1, 0)) "h16",
SUM (DECODE (TO_CHAR (first_time, 'hh24'), '17', 1, 0)) "h17",
SUM (DECODE (TO_CHAR (first_time, 'hh24'), '18', 1, 0)) "h18",
SUM (DECODE (TO_CHAR (first_time, 'hh24'), '19', 1, 0)) "h19",
SUM (DECODE (TO_CHAR (first_time, 'hh24'), '20', 1, 0)) "h20",
SUM (DECODE (TO_CHAR (first_time, 'hh24'), '21', 1, 0)) "h21",
SUM (DECODE (TO_CHAR (first_time, 'hh24'), '22', 1, 0)) "h22",
SUM (DECODE (TO_CHAR (first_time, 'hh24'), '23', 1, 0)) "h23", to_char(ROUND (COUNT (1) / 24, 2),'fm99999999990.00') "Avg"
FROM gv$log_history
WHERE first_time >= trunc(SYSDATE) - 7
and thread# = inst_id
GROUP BY TRUNC (first_time), TO_CHAR (first_time, 'Dy')
ORDER BY 1 DESC;
SQL> SQL> SQL> SQL> SQL> SQL> SQL> SQL> SQL> SQL> SQL> SQL> SQL> SQL> SQL> SQL> SQL> SQL> SQL> SQL> SQL> SQL> SQL> SQL> SQL> SQL> SQL>   2    3    4    5    6    7    8    9   10   11   12   13   14   15   16   17   18   19   20   21   22   23   24   25   26   27   28   29   30
Date                Day         Total   H0   h1   h2   h3   h4   h5   h6   h7   h8   h9  h10  h11  h12  h13  h14  h15  h16  h17  h18  h19  h20  h21  h22  h23 Avg
------------------- ------ ---------- ---- ---- ---- ---- ---- ---- ---- ---- ---- ---- ---- ---- ---- ---- ---- ---- ---- ---- ---- ---- ---- ---- ---- ---- ---------------
2025-12-08 00:00:00 Mon          1823   48    6    8    7    8    7    8    7   11  755  884   74    0    0    0    0    0    0    0    0    0    0    0    0 75.96
2025-12-07 00:00:00 Sun           480   38    8    9    8    6    8    9    7    9    9    9    8    8    8    9    8    9    8    8    9    7    7   10  261 20.00
2025-12-06 00:00:00 Sat           520   32    8    8    7    7   10    9    9    9    9   42    9    9    9    8    9    9    9    8    9    9    8    8  266 21.67
2025-12-05 00:00:00 Fri           568   33    9   11    8    7    9    9    9    9   19   19   18   13   11   15   17   23   16   11   10    7    9   10  266 23.67
2025-12-04 00:00:00 Thu           581   42    9   10    9    8    9    9    8   12   24   18   17   11   24   16   18   20   14   12    9    9    8   11  254 24.21
2025-12-03 00:00:00 Wed           585   55    8   10    8    7   10    9   10   12   14   19   20   11   13   19   20   20   17   11   10    8    9   10  255 24.38
2025-12-02 00:00:00 Tue           603   48    9   10    7    7   10    8    8   12   31   18   21   11   12   22   32   21   27   20   14    8   10   10  227 25.13
2025-12-01 00:00:00 Mon           554   51    7    7    6    7    7    8    7   10   14   18   17   11   13   16   18   17   17   14    8    8    9   11  253 23.08

8 rows selected.

SQL>
三、AWR報告分析
拉取10:00~11:00的AWR報告
SQL> @$ORACLE_HOME/rdbms/admin/awrrpt.sql
3.1 整體負載概況
DB Time:29,845s ≈ 497 分鐘,AAS ≈ 29,845 / (59×60) ≈ 8.4 個活躍會話
DB CPU ≈ 6,541s → 每秒約 1.84 CPU 秒,用滿 16 核只用了 約 11–12% 的 CPU
OS 負載:%busy ~ 11.8%,%idle ~ 88%,%iowait ~ 5.4%
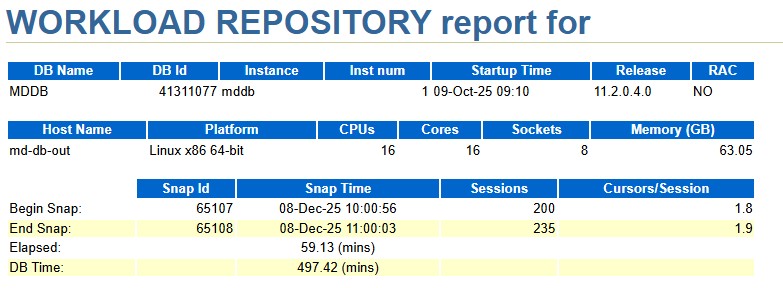
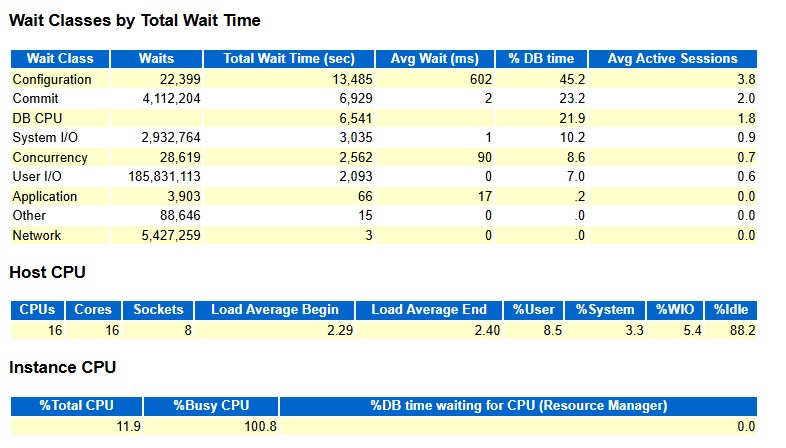
結論:CPU 很空閑,系統總體是“等待型”而不是“CPU 打滿型”。
3.2 Top Wait Events
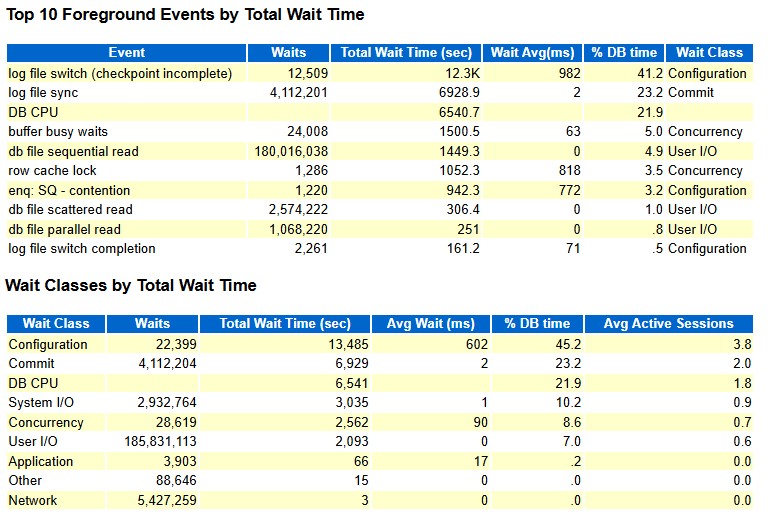
查看Top Wait 事件,找到真正卡在哪里。Top 10 Foreground Events:
log file switch (checkpoint incomplete)
-
Waits:12,509
-
Total Wait Time:≈ 12,288s(占 DB time ~41%)
-
Avg wait:982 ms / 次
log file sync
- Waits:4,112,201
- Total Wait Time:≈ 6,929s(占 DB time ~23%)
- Avg wait:2 ms / 次
- 大約 1,160 次 commit/s 左右
Wait Class 匯總也印證了這一點:
- Configuration:45%(主要就是各種 log file switch、SQ contention 等)
- Commit:23%(log file sync)
- DB CPU:22%
- Concurrency:8.6%
- User I/O:7%
結論:絕大部分時間都耗在 redo / checkpoint 配置和并發控制上。
3.3 定位 SQL:高頻 UPDATE
在 “SQL ordered by Elapsed Time” 中,你定位到 SQL ID:0vq0s6rm8fawn。它在 60 分鐘內執行 3,763,703 次,約 1000+ 次/秒 UPDATE,直接帶來大量 redo / 歸檔與頻繁 log switch。
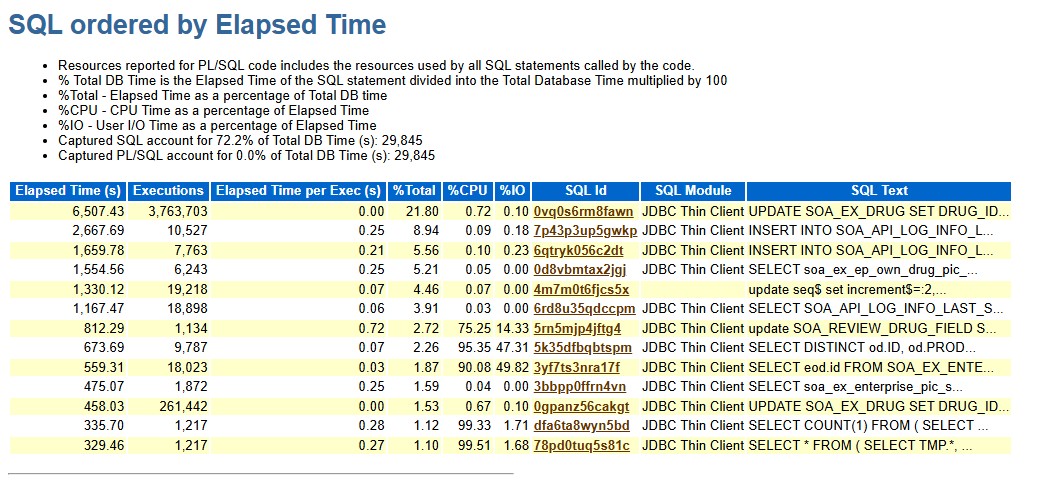
SQL如下:
UPDATE SOA_EX_DRUG SET DRUG_ID=:1 , CMM_NAME=:2 , CMMDT_NM=:3 , MED_CTGY_TYPE=:4 , NORM=:5 , MIN_PCKNG_CMPNY=:6 , APRV_NO=:7 , PRDCT_PLT=:8 , status=:9 , CNTRY_NAME=:10 , DEVICES=:11 , PRV_APRV_NO=:12 , CMM_NAME_PY=:13 , PRDCT_CREDIT=:14 , PRDCT_ID=:15 , PACK_QUANTITY=:16 , MGT_CAT_NAME=:17 , PROD_CAT_NAME=:18 , REGIST_FORM_NAME=:19 , CLASS_SUBCATALOG_V17_NAME=:20 , LEVEL1_PROD_CAT_V17_NAME=:21 , LEVEL2_PROD_CAT_V17_NAME=:22 , SPU_FLAG=:23 WHERE ID=:24
進一步用 dba_hist_sqlstat 驗證:12/5 之前 executions 僅 2 萬級,到了 12/8 突增到 300 萬級(增長 167 倍)。
SQL> set linesize 300
SQL> select a.snap_id,b.begin_interval_time,a.executions_delta from dba_hist_sqlstat a,dba_hist_snapshot b where a.sql_id='0vq0s6rm8fawn' and a.snap_id=b.snap_id order by a.snap_id;

   SNAP_ID BEGIN_INTERVAL_TIME                                                              EXECUTIONS_DELTA
---------- -------------------------------------------------------------------------------- ----------------
     64968 02-DEC-25 02.00.04.126 PM                                                                   22446
     64969 02-DEC-25 03.00.06.304 PM                                                                   35605
     64989 03-DEC-25 11.00.53.713 AM                                                                   25956
     65011 04-DEC-25 09.00.47.148 AM                                                                   22293
     65018 04-DEC-25 04.00.05.309 PM                                                                   15736
     65040 05-DEC-25 02.00.01.717 PM                                                                    5283
     65042 05-DEC-25 04.00.06.122 PM                                                                   51054
     65107 08-DEC-25 09.00.51.667 AM                                                                 3144734
     65108 08-DEC-25 10.00.56.171 AM                                                                 3763703
     65109 08-DEC-25 11.00.03.946 AM                                                                  318640
     65110 08-DEC-25 12.00.35.037 PM                                                                 3151397
     65111 08-DEC-25 01.00.43.053 PM                                                                 3999423
     65112 08-DEC-25 02.00.29.114 PM                                                                 2629413

13 rows selected.

SQL>
一直到下午14點多查看oratop還是顯示SQL Id:0vq0s6rm8fawn頻繁執行。造成大量log file switch (checkpoint incomplete)等待。
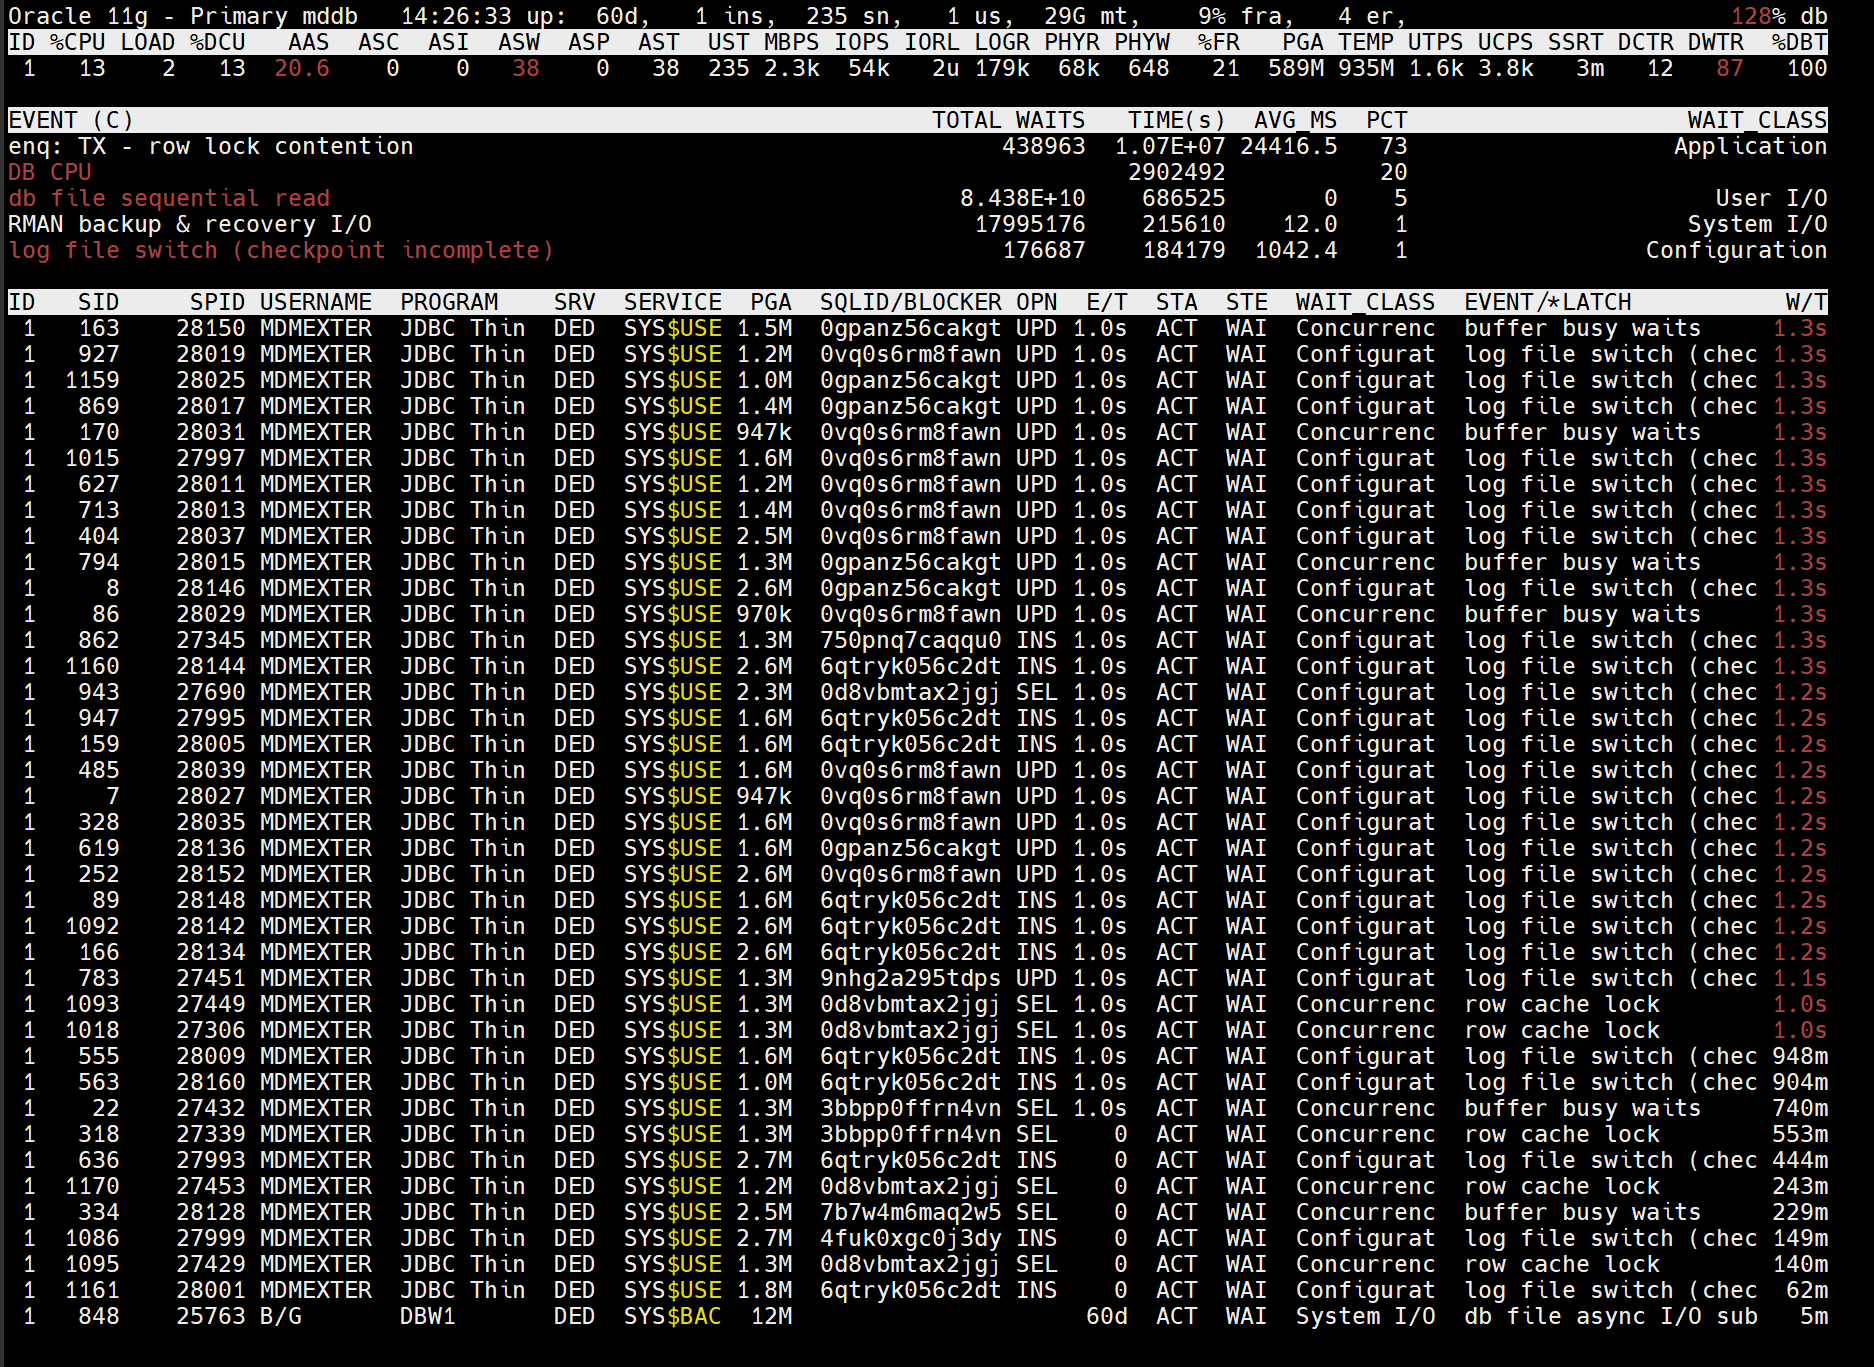
結論:高頻的更新SQL語句,導致log file switch (checkpoint incomplete)一小時內 12,509 次,平均每次接近 1 秒
四、問題解決
4.1 應用側
第一步:與開發溝通,把高頻 SQL 告知對方,推動應用修改。
應用修改后,日志切換頻率正常。如下:
SQL> SELECT TRUNC (first_time) "Date", TO_CHAR (first_time, 'Dy') "Day", COUNT (1) "Total",
SUM (DECODE (TO_CHAR (first_time, 'hh24'), '00', 1, 0)) h0,
SUM (DECODE (TO_CHAR (first_time, 'hh24'), '01', 1, 0)) "h1",
SUM (DECODE (TO_CHAR (first_time, 'hh24'), '02', 1, 0)) "h2",
SUM (DECODE (TO_CHAR (first_time, 'hh24'), '03', 1, 0)) "h3",
SUM (DECODE (TO_CHAR (first_time, 'hh24'), '04', 1, 0)) "h4",
SUM (DECODE (TO_CHAR (first_time, 'hh24'), '05', 1, 0)) "h5",
SUM (DECODE (TO_CHAR (first_time, 'hh24'), '06', 1, 0)) "h6",
SUM (DECODE (TO_CHAR (first_time, 'hh24'), '07', 1, 0)) "h7",
SUM (DECODE (TO_CHAR (first_time, 'hh24'), '08', 1, 0)) "h8",
SUM (DECODE (TO_CHAR (first_time, 'hh24'), '09', 1, 0)) "h9",
SUM (DECODE (TO_CHAR (first_time, 'hh24'), '10', 1, 0)) "h10",
SUM (DECODE (TO_CHAR (first_time, 'hh24'), '11', 1, 0)) "h11",
SUM (DECODE (TO_CHAR (first_time, 'hh24'), '12', 1, 0)) "h12",
SUM (DECODE (TO_CHAR (first_time, 'hh24'), '13', 1, 0)) "h13",
SUM (DECODE (TO_CHAR (first_time, 'hh24'), '14', 1, 0)) "h14",
SUM (DECODE (TO_CHAR (first_time, 'hh24'), '15', 1, 0)) "h15",
SUM (DECODE (TO_CHAR (first_time, 'hh24'), '16', 1, 0)) "h16",
SUM (DECODE (TO_CHAR (first_time, 'hh24'), '17', 1, 0)) "h17",
SUM (DECODE (TO_CHAR (first_time, 'hh24'), '18', 1, 0)) "h18",
SUM (DECODE (TO_CHAR (first_time, 'hh24'), '19', 1, 0)) "h19",
SUM (DECODE (TO_CHAR (first_time, 'hh24'), '20', 1, 0)) "h20",
SUM (DECODE (TO_CHAR (first_time, 'hh24'), '21', 1, 0)) "h21",
SUM (DECODE (TO_CHAR (first_time, 'hh24'), '22', 1, 0)) "h22",
SUM (DECODE (TO_CHAR (first_time, 'hh24'), '23', 1, 0)) "h23", to_char(ROUND (COUNT (1) / 24, 2),'fm99999999990.00') "Avg"
FROM gv$log_history
WHERE first_time >= trunc(SYSDATE) - 7
and thread# = inst_id
GROUP BY TRUNC (first_time), TO_CHAR (first_time, 'Dy')
ORDER BY 1 DESC;  2    3    4    5    6    7    8    9   10   11   12   13   14   15   16   17   18   19   20   21   22   23   24   25   26   27   28   29   30

Date                Day         Total   H0   h1   h2   h3   h4   h5   h6   h7   h8   h9  h10  h11  h12  h13  h14  h15  h16  h17  h18  h19  h20  h21  h22  h23 Avg
------------------- ------ ---------- ---- ---- ---- ---- ---- ---- ---- ---- ---- ---- ---- ---- ---- ---- ---- ---- ---- ---- ---- ---- ---- ---- ---- ---- ---------------
2025-12-10 00:00:00 Wed           333   56    9   10    7    7    8    7    9   18   22   20   16   13   12   16   18   19   16   10    7    8    7    9    9 13.88
2025-12-09 00:00:00 Tue           607    0    0    0    0    0    0    0    0   67   72   16   15   10   12   17   19   44   27   11   10    7    8    7  265 25.29
2025-12-08 00:00:00 Mon          4364   48    6    8    7    8    7    8    7   11  755  884   83  725  884  622   17   17   14    9    9    7    7   10  211 181.83
2025-12-07 00:00:00 Sun           480   38    8    9    8    6    8    9    7    9    9    9    8    8    8    9    8    9    8    8    9    7    7   10  261 20.00
2025-12-06 00:00:00 Sat           520   32    8    8    7    7   10    9    9    9    9   42    9    9    9    8    9    9    9    8    9    9    8    8  266 21.67
2025-12-05 00:00:00 Fri           568   33    9   11    8    7    9    9    9    9   19   19   18   13   11   15   17   23   16   11   10    7    9   10  266 23.67
2025-12-04 00:00:00 Thu           581   42    9   10    9    8    9    9    8   12   24   18   17   11   24   16   18   20   14   12    9    9    8   11  254 24.21
2025-12-03 00:00:00 Wed           585   55    8   10    8    7   10    9   10   12   14   19   20   11   13   19   20   20   17   11   10    8    9   10  255 24.38
SQL>
4.2 數據庫側:擴大 redo log size(從 50MB 擴到 2GB)
當時的 redo 配置:3 組、每組 50MB(默認)。然后新增 3 組 2GB(group 4/5/6),切換后刪除舊組(1/2/3)。檢查 checkpoint / mttr 參數,查看 FAST_START_MTTR_TARGET / LOG_CHECKPOINT_INTERVAL / LOG_CHECKPOINT_TIMEOUT避免設置得太小,導致頻繁 checkpoint。
-- 1) 查看現狀
SQL> select group#, bytes/1024/1024 mb, status from v$log;

    GROUP#         MB STATUS
---------- ---------- ----------------
         1         50 CURRENT
         2         50 INACTIVE
         3         50 INACTIVE

SQL> col member for a80
SQL> select group#, member from v$logfile;

    GROUP# MEMBER
---------- --------------------------------------------------------------------------------
         1 /u01/app/oracle/oradata/mddb/redo01.log
         2 /u01/app/oracle/oradata/mddb/redo02.log
         3 /u01/app/oracle/oradata/mddb/redo03.log

-- 2) 新增大 redo
SQL> alter database add logfile group 4 '/u01/app/oracle/oradata/mddb/redo04.log' size 2g;

Database altered.

SQL> alter database add logfile group 5 '/u01/app/oracle/oradata/mddb/redo05.log' size 2g;

Database altered.

SQL> alter database add logfile group 6 '/u01/app/oracle/oradata/mddb/redo06.log' size 2g;

Database altered.

-- 3) 手工切換,確保舊組不再 ACTIVE/CURRENT,再刪除
SQL> alter system switch logfile;

System altered.

SQL> /

System altered.

SQL> select group#, bytes/1024/1024 mb, status from v$log;

    GROUP#         MB STATUS
---------- ---------- ----------------
         1         50 INACTIVE
         2         50 INACTIVE
         3         50 INACTIVE
         4       2048 INACTIVE
         5       2048 ACTIVE
         6       2048 CURRENT

6 rows selected.

SQL> alter database drop logfile group 1;

Database altered.

SQL> alter database drop logfile group 2;

Database altered.

SQL> alter database drop logfile group 3;

Database altered.

-- 4) 驗證
SQL> select group#, bytes/1024/1024 mb, status from v$log;

    GROUP#         MB STATUS
---------- ---------- ----------------
         4       2048 INACTIVE
         5       2048 ACTIVE
         6       2048 CURRENT

-- 5) 檢查參數,為默認,系統自動觸發/控制 checkpoint
SQL> show parameter fast_start_mttr_target

NAME                                 TYPE        VALUE
------------------------------------ ----------- ------------------------------
fast_start_mttr_target               integer     0
SQL> show parameter log_check

NAME                                 TYPE        VALUE
------------------------------------ ----------- ------------------------------
log_checkpoint_interval              integer     0
log_checkpoint_timeout               integer     1800
log_checkpoints_to_alert             boolean     FALSE
SQL>
五、總結
12 月 8 日 11 點生產庫磁盤使用率超過 90%,排查發現主要由歸檔日志快速增長導致(/u01 下 fast_recovery_area 占用明顯)。進一步查看日志切換,9 點后歸檔切換從 11 次飆升到 755 次。拉取 10:00–11:00 AWR 后確認系統屬于“等待型”,主要等待集中在 log file switch (checkpoint incomplete)(12,509 次,約 41% DB time)和 log file sync(4,112,201 次,約 23% DB time)。同期 Top SQL 中 0vq0s6rm8fawn 在 60 分鐘內執行 3,763,703 次(約 1000+ 次/秒),并且相較 12/5 執行次數突增 167 倍,是導致 redo/歸檔暴漲的關鍵誘因。處置上先通知開發處理高頻 SQL,同時將 redo log 從 50MB 3 組擴容為 2GB 3 組并完成切換與清理,緩解日志切換與 checkpoint 壓力。
