


1、情況描述
2026新年第二個工作日,收到Oracle告警如下。
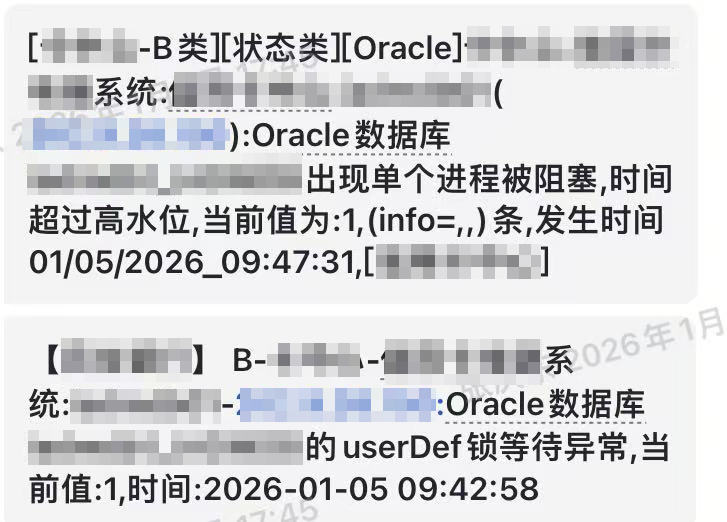
看到以為只是簡單的阻塞問題,排查后發現阻塞源頭是一個執行了十幾個小時還沒結束的update操作。
與研發人員溝通后,得知該SQL是晚上8點半開始執行的批處理任務中的一個操作,正常情況下20分鐘能執行完。這種情況之前也偶爾出現過,但之前沒有造成什么影響就沒有關注。不過這次已經影響到了正常的業務,所以先將該SQL kill掉,再進行排查。
SQL文本如下,因為保密和隱私,進行了表和字段的替換,sql_id為 73v0z2m8ypg8w。
update problem_table1 h
   set (h.stime,h.etime,h.clong,h.ctime)=(select t.stime,t.etime,t.clong,t.stime from problem_table2 t
        where h.cid=t.cid)
 where exists (select 1 from problem_table2 t where t.cid=h.cid)
   and substr(h.stime,0,10)=to_char(sysdate,'yyyy-mm-dd')
   and h.flag='1'
SQL的基本信息如下。
(1)problem_table1(別名 h):1億行數據;
(2)problem_table2(別名 t):80萬行數據;
(3)兩表的關聯字段cid有索引;problem_table1中有substr(h.stime,0,10)的函數索引;
2、排查過程
2.1、查看執行計劃是否變化
因為該SQL之前跑著正常,這一次突然變慢了,所以首先懷疑是執行計劃發生變化。
查詢ASH,看執行計劃更改時間。
select * from
(select
to_char(sample_time,'yyyy-mm-dd') as stime,
sql_plan_hash_value
from dba_hist_actice_sess_history ash)
group by stime,sql_plan_hash_value
order by 1;
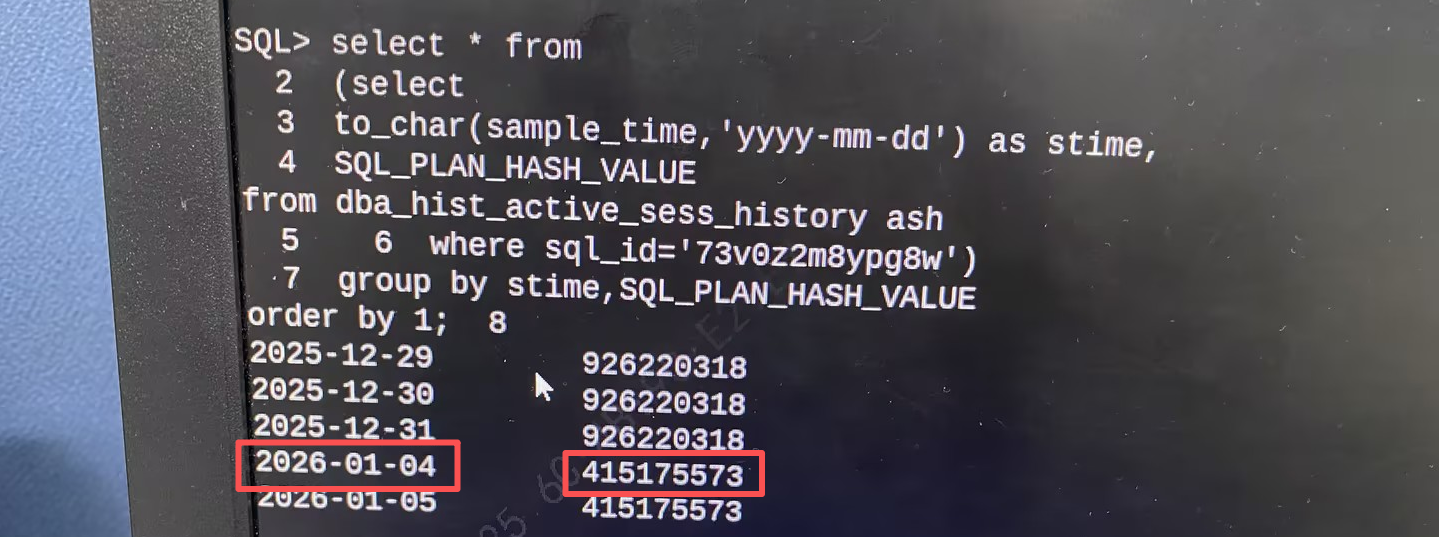
輸出結果如下。可以發現在2026-01-04日執行時,執行計劃發生改變,與出問題的時間吻合。其中 926220318 是執行速度快的執行計劃,415175573是執行速度慢的執行計劃。
2.2、執行計劃分析
查看SQL的2種執行計劃。
select * from table(dbms_xplan.display_awr('73v0z2m8ypg8w'));
快plan:926220318
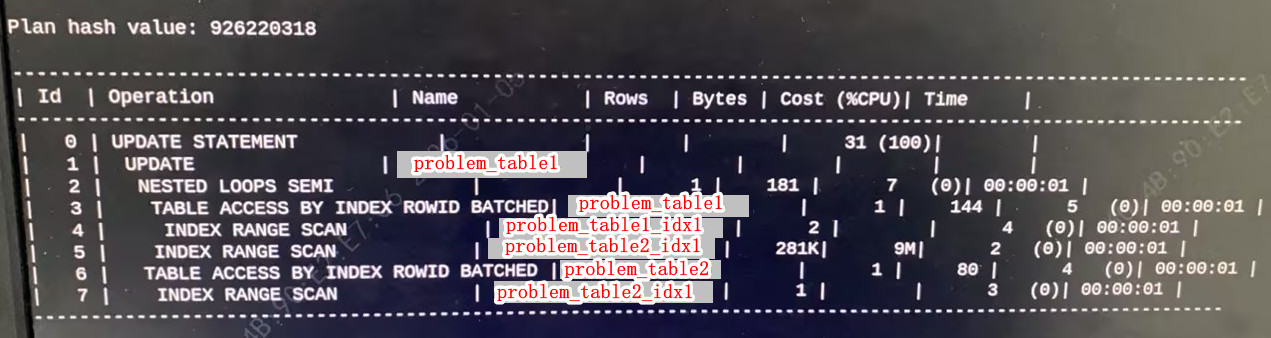
926220318 執行計劃順序:
4 —> 3 —> 5 —> 2 —> 7 —> 6 —> 1 —> 0
926220318 執行計劃重點:
以problem_table1為驅動表,problem_table2為被驅動表,進行 nest loops semi連接。推測的偽代碼如下:
declare
  cursor cur_problem_table1 is
    select cid from problem_table1 where substr(stime,0,10)=to_char(sysdate,'yyyy-mm-dd') and h.flag='1';
	v_cid problem_table2.cid%type;
begin
  for x in cur_problem_table1 loop
    select cid into v_cid from problem_table2;
	dbms_output.put_line(x.cid);
  end loop;
end;
其中problem_table1謂詞過濾后返回的結果集數量在20萬左右,problem_table2的數據量則在80萬左右。即對被驅動表進行20萬次索引掃描。
慢plan:415175573
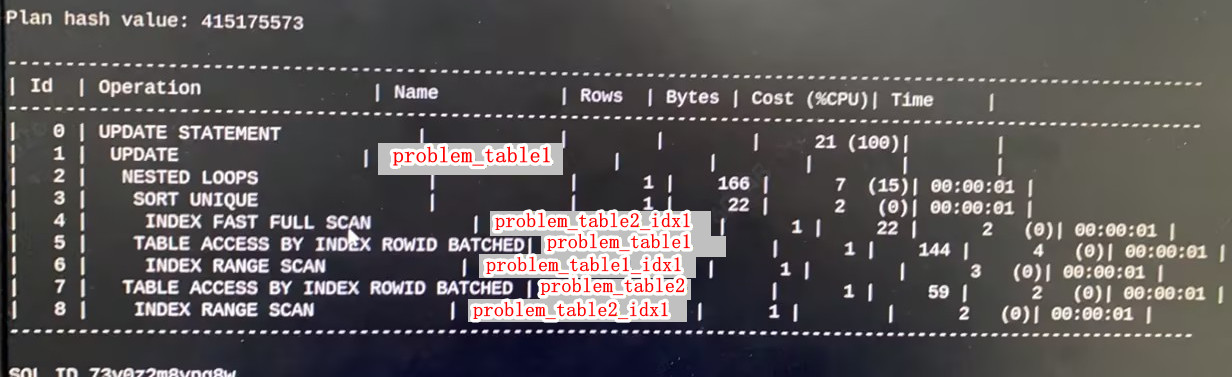
415175573 執行計劃順序:
4 —> 3 —> 6 —> 5 —> 2—> 8 —> 7 —> 1 —> 0
415175573 執行計劃重點:
415175573 以problem_table2為驅動表,problem_table1為被驅動表,進行 nest loops 連接。推測的偽代碼如下:
declare
  cursor cur_problem_table2 is
    select cid from problem_table2;
	v_cid problem_table1.cid%type;
begin
  for x in cur_problem_table2 loop
    select cid into v_cid from problem_table1 where substr(stime,0,10)=to_char(sysdate,'yyyy-mm-dd')
		and h.flag='1' and cid=x.cid;
	dbms_output.put_line(x.cid);
  end loop;
end;
其中,problem_table2有 75萬 的數據量,problem_table1有 1億 的數據量。與926220318執行計劃相比,驅動表的數據量本身就增加了近4倍,而被驅動表的數據量較之前劇增至1億,且數據量這么龐大的被驅動表要被掃描80萬次,性能自然驟降,這是415175573計劃的SQL一直執行不出來結果的核心原因。
造成這種驅動表變化的最大可能原因是統計信息發生了巨變。
Oracle優化器認為以problem_table2為驅動表效率會更高。所以需要進一步查看統計信息是否準確。
2.3、查看統計信息是否過舊
select
dts.owner,
dts.table_name,
to_char(dts.last_analyzed,'yyyy-mm-dd hh24:mi:ss') as last_analyzed,
num_rows
from dba_tab_statistics dts
where dts.owner=upper('tq')
  and dts.table_name=upper('problem_table1')
檢查后發現problem_table1、problem_table2兩張表的統計信息都沒有過舊,最近一次收集時間是2025-01-05 01:00 收集的,num_rows也和實際情況對得上。
繼續檢查近一段時間內,兩張表的統計信息收集情況。
set linesize 200 pagesize 200
col owner format a12
col object_name format a24
col analyzed format a18
col rowcnt format 9999999999
col blkcnt format 99999999
select a.owner,
       a.object_name,
       to_char(b.ANALYZETIME,'yyyymmdd hh24:mi:ss') as analyzed,
       b.rowcnt,
       b.blkcnt
  from dba_objects a,wri$_optstat_tab_history b
 where a.object_type = 'TABLE'
   and a.object_name  = upper('&table_name')
   and a.object_id = b.obj#
  order by 1,2,3;
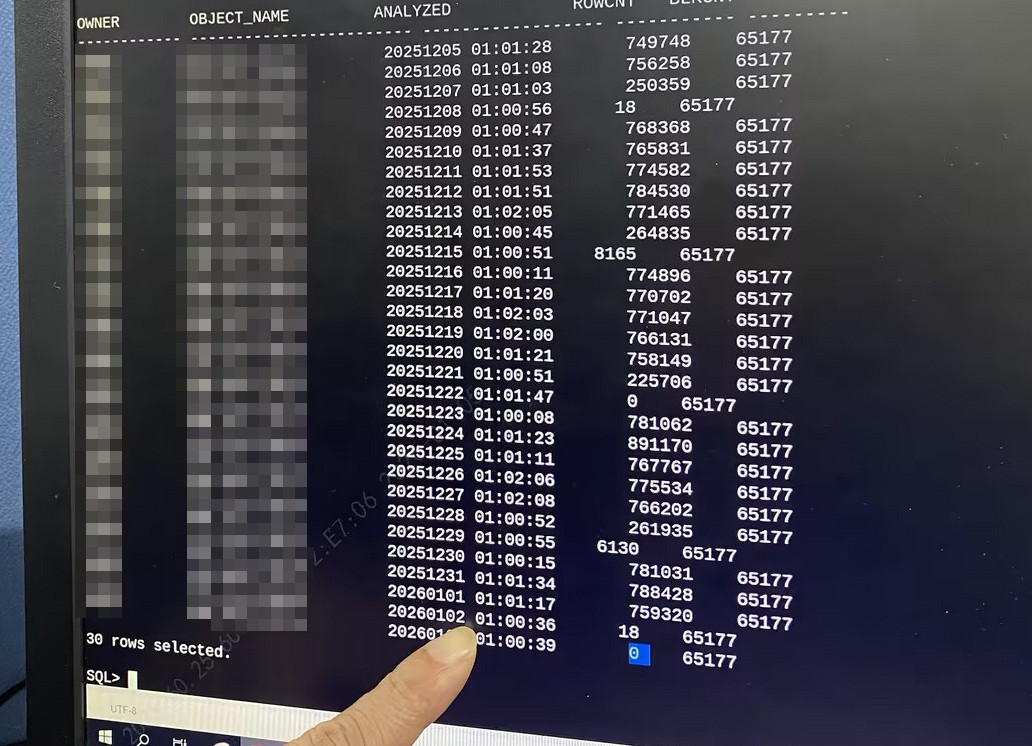
輸出結果如圖所示。在圖中我們可以看到problem_table2的統計信息基本平穩,但是在2026.1.3 收集的problem_table2表統計信息行數量是 0 !這是一個大問題,是導致 2026 .1.4 晚上批處理執行SQL時,SQL執行計劃更改驅動表的直接原因。
2.4、業務溝通
至于為什么 2026.1.3 problem_table2 的數據量是 0,這里在和業務研發方面進行溝通,終于真相大白:
Oracle數據庫每天凌晨1點收集統計信息。
problem_table2 這張表只保留一天的數據量。在批處理任務中,先刪除這張表所有數據,再插入數據,再執行這個sql_id為 73v0z2m8ypg8w 的SQL。
problem_table2 每天的數據量基本上是平穩的,但是遇到節假日、周末,problem_table2表的數據量很少甚至為0。
以這次為例,2026.1.4晚上20:30點執行批處理任務時,4號是工作日,當天的數據有70多萬;但是統計信息此時還未更新,還是認為problem_table2表的數據量是0,Oracle 優化器認為以problem_table2為驅動表最優,此時執行計劃變了,變成了最低效的執行計劃。
3、解決方案
在排查清楚原因后,解決方案就比較清晰了:更改批處理任務執行時間或者綁定執行計劃。在與研發人員溝通后,最終還是選擇了綁定執行計劃的解決方案。
使用sqlt工具進行執行計劃綁定,該工具可以從MOS上獲取。綁定執行計劃步驟:
(1)上傳sqlt壓縮包并解壓
(2)運行分析腳本
73v0z2m8ypg8w是目標SQL的sql_id
cd /home/oracle/sqlt/utl
sqlplus / as sysdba
@coe_xfr_sql_profile.sql 73v0z2m8ypg8wmh


SQL_ID (required)
PLAN_HASH_VALUE AVG_ET_SECS
--------------- -----------
926220318         xxx
415175573         xxx

--根據提示,輸入人工判斷最優的執行計劃 hash value
Parameter 2:
PLAN_HASH_VALUE (required)
Enter value for 2: 926220318


--確認信息如下
Values passed:
~~~~~~~~~~~~~
SQL_ID         : "73v0z2m8ypg8wmh"
PLAN_HASH_VALUE: "926220318"

--上述步驟完成后,會提示執行生成的 sql profile腳本
Execute coe_xfr_sql_profile_cdwjdd67x27mh_2979024279.sql
on TARGET system in order to create a custom SQL Profile
with plan 2979024279 linked to adjusted sql_text.
(3)運行輸出結果中的sql腳本
@coe_xfr_sql_profile_cdwjdd67x27mh_2979024279.sql
(4)檢查綁定情況
select name, SQL_TEXT, status from dba_sql_profiles;
4、總結反思
優化慢SQL時,SQL往往都已經執行結束或者被動結束了,此時的統計信息不能完全說明SQL執行時的真實情況。
Oracle 執行計劃的突然改變往往和統計信息脫不了關系,對于統計信息的檢查不能只著眼于最近一次收集情況,需要縱向觀察近期內統計信息的收集情況。
