


問題描述
今天有個朋友在Oracle 10.2.0.5.0 環境遇到了這個報錯,記錄下分析和處理過程
ORA-00600: internal error code, arguments: [kcblasm_1], [103], [], [], [], [], [], []
# 類似以下語句:
select owner,sum(object_id) from t3
where a.createdate > date'2025-11-01' group by owner;
問題分析
檢查執行計劃
Plan hash value: 3640192438

---------------------------------------------------------------------------
| Id  | Operation	   | Name | Rows  | Bytes | Cost (%CPU)| Time	  |
---------------------------------------------------------------------------
|   0 | SELECT STATEMENT   |	  |    26 |   260 |   396   (1)| 00:00:01 |
|   1 |  HASH GROUP BY	   |	  |    26 |   260 |   396   (1)| 00:00:01 |
|   2 |   TABLE ACCESS FULL| T3   | 72655 |   709K|   394   (1)| 00:00:01 |
---------------------------------------------------------------------------

9 rows selected.

SQL>
可以看到這里執行了 HASH GROUP BY 操作。
call stack
----- Call Stack Trace -----
calling              call     entry                argument values in hex
location             type     point                (? means dubious value)
-------------------- -------- -------------------- ----------------------------
ssd_unwind_bp: unhandled instruction at 0x3d06236 instr=f
ksedst()+31          call     ksedst1()            000000000 ? 000000001 ?
                                                   7FFFD8541880 ? 7FFFD85418E0 ?
                                                   7FFFD8541820 ? 000000000 ?
ksedmp()+610         call     ksedst()             000000000 ? 000000001 ?
                                                   7FFFD8541880 ? 7FFFD85418E0 ?
                                                   7FFFD8541820 ? 000000000 ?
ksfdmp()+63          call     ksedmp()             000000003 ? 000000001 ?
                                                   7FFFD8541880 ? 7FFFD85418E0 ?
                                                   7FFFD8541820 ? 000000000 ?
kgerinv()+161        call     ksfdmp()             006AD9340 ? 000000003 ?
                                                   7FFFD8541880 ? 7FFFD85418E0 ?
                                                   7FFFD8541820 ? 000000000 ?
kgeasnmierr()+163    call     kgerinv()            006AD9340 ? 007548EF8 ?
                                                   7FFFD85418E0 ? 7FFFD8541820 ?
                                                   000000000 ? 000000000 ?
kcblasm1()+113       call     kgeasnmierr()        006AD9340 ? 007548EF8 ?
                                                   7FFFD85418E0 ? 7FFFD8541820 ?
                                                   000000000 ? 000000067 ?
kcblasm()+52         call     kcblasm1()           7F545F539E38 ? 7FFFD8541820 ?
                                                   7FFFD85418E0 ? 7FFFD8541820 ?
                                                   000000000 ? 000000067 ?
qeshsFindFreeSlot()  call     kcblasm()            7F545F539E38 ? 000001000 ?
+282                                               7FFFD85418E0 ? 7FFFD8541820 ?
                                                   000000000 ? 000000067 ?
qeshfFindFreeSlot()  call     qeshsFindFreeSlot()  7F545F5C97D0 ? 7FFFD8542924 ?
+35                                                7FFFD85418E0 ? 7FFFD8541820 ?
                                                   000000000 ? 000000067 ?
qeshBufferAlloc()+3  call     qeshfFindFreeSlot()  7F545F5C97D0 ? 7F545F5C8E88 ?
04                                                 7FFFD8542924 ? 7FFFD8541820 ?
                                                   000000000 ? 000000067 ?
qeshBufferGetNew()+  call     qeshBufferAlloc()    7F545F5C8E88 ? 7F5442E14600 ?
170                                                7F545F5C8FB8 ? 7FFFD8541820 ?
                                                   000000000 ? 000000067 ?
ksxb1bqb()+178       call     qeshBufferGetNew()   7F545F5C8FB0 ? 7F5442E14600 ?
                                                   7F545F5C8FB8 ? 7FFFD8541820 ?
                                                   000000000 ? 000000067 ?
qeshrPackRowQB()+23  call     ksxb1bqb()           7F545F5C8FB0 ? 2FECBBB5D4 ?
64                                                 000000002 ? 7FFFD8541820 ?
                                                   000000000 ? 000000067 ?
qeshrPackRow_Fast()  call     qeshrPackRowQB()     7F545F5C9620 ? 7F545F5C95A8 ?
+1079                                              000000001 ? 7FFFD8542C04 ?
                                                   000000002 ? 000000008 ?
qeshLoadRowForGBY()  call     qeshrPackRow_Fast()  7F545F5C9620 ? 7F545F5C95A8 ?
+814                                               7FFFD8542C04 ? 7F545F485E48 ?
                                                   000000008 ? 7F545F5C8FB0 ?
qerghRowP()+562      call     qeshLoadRowForGBY()  7F545F5C8E88 ? 7F545F485E48 ?
                                                   000000008 ? 7F545F485E48 ?
                                                   000000008 ? 7F545F5C8FB0 ?
kdstf1100101km()+74  call     qerghRowP()          49C2DCA2A8 ? 000007FFF ?
6                                                  000000008 ? 7F545F485D58 ?
                                                   7F545F485E48 ? 49C2DCA278 ?
kdsttgr()+1170       call     kdstf1100101km()     000000021 ? 000000000 ?
                                                   002FA20CA ? 49C2DCA2A8 ?
                                                   2FECBBB5C8 ? 000000002 ?
qertbFetch()+650     call     kdsttgr()            7F545F485678 ? 000000000 ?
                                                   2FECBBA0D0 ? 000000000 ?
                                                   2FECBBB5C8 ? 002FA20CA ?
qerghFetch()+271     call     qertbFetch()         49C2DCA730 ? 002FA20CA ?
                                                   49C2DCA2A8 ? 000007FFF ?
                                                   49C2DCA7A0 ? 002FA20CA ?
rwsfcd()+88          call     qerghFetch()         49C2DCA2A8 ? 002EDCDF0 ?
                                                   49C2DC9FF0 ? 000007FFF ?
                                                   49C2DCA7A0 ? 7F545F485D58 ?
qerltFetch()+1008    call     rwsfcd()             49C2DCA2A8 ? 002EDCDF0 ?
                                                   49C2DC9FF0 ? 000007FFF ?
                                                   49C2DCA7A0 ? 7F545F485D58 ?
ctcdrv()+8029        call     qerltFetch()         49C2DC9FF0 ? 00134EE78 ?
                                                   7FFFD85453F0 ? 000000001 ?
                                                   49C2DCA7A0 ? 49C2AE2FC0 ?
opiexe()+13023       call     ctcdrv()             49C24B5E78 ? 000060655 ?
                                                   7FFFD85462D8 ? 000000001 ?
                                                   66381AF90000001A ?
                                                   49C2AE2FC0 ?
opiosq0()+3398       call     opiexe()             000000004 ? 000000000 ?
                                                   7FFFD854686C ? 000000001 ?
                                                   66381AF90000001A ?
                                                   49C2AE2FC0 ?
kpooprx()+318        call     opiosq0()            000000003 ? 00000000E ?
                                                   7FFFD8546B98 ? 0000000A4 ?
                                                   000000000 ? 60000011E ?
kpoal8()+783         call     kpooprx()            7FFFD8549D7C ? 7FFFD8547CC8 ?
                                                   00000011E ? 000000001 ?
                                                   000000000 ? 60000011E ?
opiodr()+1184        call     kpoal8()             00000005E ? 000000017 ?
                                                   7FFFD8549D78 ? 000000001 ?
                                                   000000001 ? 60000011E ?
ttcpip()+1226        call     opiodr()             00000005E ? 000000017 ?
                                                   7FFFD8549D78 ? 000000000 ?
                                                   005BDF250 ? 60000011E ?
opitsk()+1310        call     ttcpip()             006AE18D0 ? 005499C20 ?
                                                   7FFFD8549D78 ? 000000000 ?
                                                   7FFFD8549878 ? 7FFFD8549EE0 ?
opiino()+1024        call     opitsk()             000000003 ? 000000000 ?
                                                   7FFFD8549D78 ? 000000001 ?
                                                   000000000 ? 6AE001100000001 ?
opiodr()+1184        call     opiino()             00000003C ? 000000004 ?
                                                   7FFFD854AF78 ? 000000001 ?
                                                   000000000 ? 6AE001100000001 ?
opidrv()+548         call     opiodr()             00000003C ? 000000004 ?
                                                   7FFFD854AF78 ? 000000000 ?
                                                   005BDED00 ? 6AE001100000001 ?
sou2o()+114          call     opidrv()             00000003C ? 000000004 ?
                                                   7FFFD854AF78 ? 000000000 ?
                                                   005BDED00 ? 6AE001100000001 ?
opimai_real()+163    call     sou2o()              7FFFD854AF50 ? 00000003C ?
                                                   000000004 ? 7FFFD854AF78 ?
                                                   005BDED00 ? 6AE001100000001 ?
main()+116           call     opimai_real()        000000002 ? 7FFFD854AFE0 ?
                                                   000000004 ? 7FFFD854AF78 ?
                                                   005BDED00 ? 6AE001100000001 ?
__libc_start_main()  call     main()               000000002 ? 7FFFD854AFE0 ?
+245                                               000000004 ? 7FFFD854AF78 ?
                                                   005BDED00 ? 6AE001100000001 ?
_start()+41          call     __libc_start_main()  000720630 ? 000000002 ?
                                                   7FFFD854B138 ? 000000000 ?
                                                   005BDED00 ? 6AE001100000001 ?
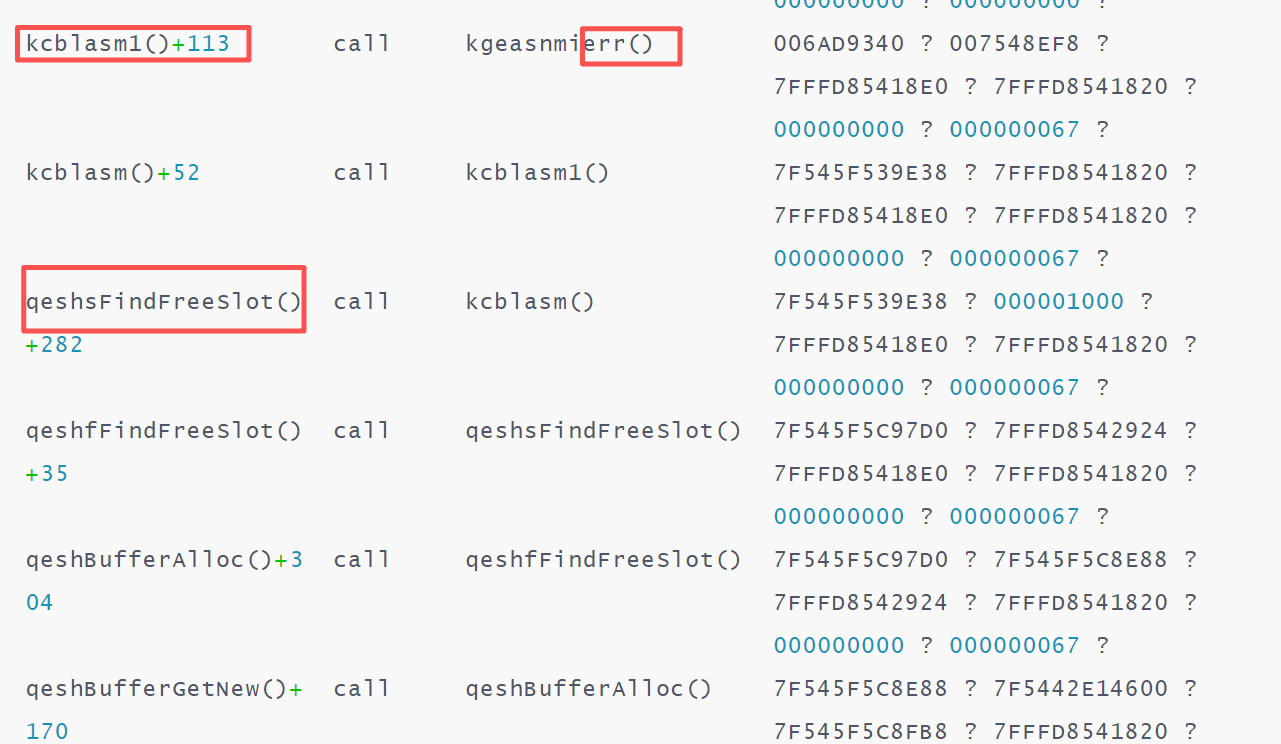
異常的call stack如下:懷疑在 Kernel Cache Buffer 中查找 FreeSlot時異常報錯。
kcblasm1()+113<<kgeasnmierr()<<kcblasm()+52<<kcblasm1()<<qeshsFindFreeSlot()+282 << kcblasm()<<qeshfFindFreeSlot()+35 << qeshsFindFreeSlot() <<qeshBufferAlloc()+304 << qeshfFindFreeSlot()<<qeshBufferGetNew()+170 << qeshBufferAlloc()
mos解釋
Applies to:
Oracle Server - Enterprise Edition - Version: 10.2.0.5.0 and later   [Release: 10.2 and later ]
Information in this document applies to any platform.


Symptoms
When executing a statement using a SELECT getting:
ORA-00600: internal error code, arguments: [kcblasm_1], [103], [], [], [], [], [], []
The execution plan from the ORA-600 trace file is showing hash join is used.
Call Stack is including:
kcblasm1 kcblasm kxhfFndFreeSlot kxhfNewBuffer qerhjGetNewBuffer ksxb1bqb kxhrPack
Cause
The issue was investigated in:
Bug 9800302 - 10.2.0.5 GETTING ORA-00600 [KCBLASM_1]
closed as duplicate of:Bug 7612454 - Abstract: DSS:PERF REGRESSIONS IN SERIAL DIRECT READS fixed in 11.2.
As per development team the number of slots available for direct I/Os (limited to 4096) forced the hash-join algorithm to operate on fewer number of slots and resulted in more spills to disk. This caused:
   direct path IO to perform. worse in 10.2.0.5 than earlier releases with more "direct path read" operations or
   ORA-600 [kcblasm_1] errors.
Solution
1. Upgrade the database to 11.2.
OR
2. Apply &incFamilyProds=false&flag=search))" target=_blank>Patch 7612454 available on MOS. If a patch is not currently available on top of your database version and/or platform. please raise a Service Request to request for it.
Please be sure that your database version qualifies for getting a new patch as per Note 209768.1 and Note 742060.1.
OR
3. Use the workaround of setting:
"_hash_join_enabled"= false


Applies to:
Oracle Server - Enterprise Edition - Version: 10.2.0.5.0 and later   [Release: 10.2 and later ]
Information in this document applies to any platform.
Symptoms
When executing a statement using a SELECT getting:
ORA-00600: internal error code, arguments: [kcblasm_1], [103], [], [], [], [], [], []
The execution plan from the ORA-600 trace file is showing hash join is used.
Call Stack is including:
kcblasm1 kcblasm kxhfFndFreeSlot kxhfNewBuffer qerhjGetNewBuffer ksxb1bqb kxhrPack
Cause
The issue was investigated in:
Bug 9800302 - 10.2.0.5 GETTING ORA-00600 [KCBLASM_1]
closed as duplicate of:Bug 7612454 - Abstract: DSS:PERF REGRESSIONS IN SERIAL DIRECT READS fixed in 11.2.
As per development team the number of slots available for direct I/Os (limited to 4096) forced the hash-join algorithm to operate on fewer number of slots and resulted in more spills to disk. This caused:
   direct path IO to perform. worse in 10.2.0.5 than earlier releases with more "direct path read" operations or
   ORA-600 [kcblasm_1] errors.
Solution
1. Upgrade the database to 11.2.
OR
2. Apply &incFamilyProds=false&flag=search))" target=_blank>Patch 7612454 available on MOS. If a patch is not currently available on top of your database version and/or platform. please raise a Service Request to request for it.
Please be sure that your database version qualifies for getting a new patch as per Note 209768.1 and Note 742060.1.
OR
3. Use the workaround of setting:
"_hash_join_enabled"= false
從mos中判斷,這個問題是10.2.0.5 bug,需要升級到11.2或打patch解決,這個bug的根因:
1. SERIAL DIRECT READS
2. the number of slots available for direct I/Os (limited to 4096)
3. forced the hash-join algorithm to operate on fewer number of slots and resulted in more spills to disk.
由于暫時不能升級版本和打補丁,臨時解決方案如下:
# 方案一、禁用hash group by
alter session set "_gby_hash_aggregation_enabled" = false;
# 方案二、禁用hash_join # 我的語句中沒有hash所以和mos還有區別
alter session set "_hash_join_enabled"=false;
# 方案三、改sql減少group by的分組數,如修改為多個sql最后union
# 方案四、禁用direct path read
# 方案五、啟動并行 parallel(32) <--嘗試方案
# 方案六、with改寫 <--把需要的列和數據用with選擇出來再group
# 方案七、創建索引或索引覆蓋,減少訪問的blocks
問題根因
As per development team the number of slots available for direct I/Os (limited to 4096) forced the hash-join algorithm to operate on fewer number of slots and resulted in more spills to disk. This caused:
    direct path IO to perform. worse in 10.2.0.5 than earlier releases with more "direct path read" operations or
    ORA-600 [kcblasm_1] errors.
解決方案
# 單表操作
方案一、禁用hash group by
alter session set "_gby_hash_aggregation_enabled" = false;
# hash join的操作
方案二、禁用hash_join
alter session set "_hash_join_enabled"=false;
朋友回復方案一操作后,問題得到解決。
最后修改時間:2026-01-18 13:52:46
「喜歡這篇文章,您的關注和贊賞是給作者最好的鼓勵」
關注作者
【版權聲明】本文為墨天輪用戶原創內容,轉載時必須標注文章的來源(墨天輪),文章鏈接,文章作者等基本信息,否則作者和墨天輪有權追究責任。如果您發現墨天輪中有涉嫌抄襲或者侵權的內容,歡迎發送郵件至:contact@modb.pro進行舉報,并提供相關證據,一經查實,墨天輪將立刻刪除相關內容。
