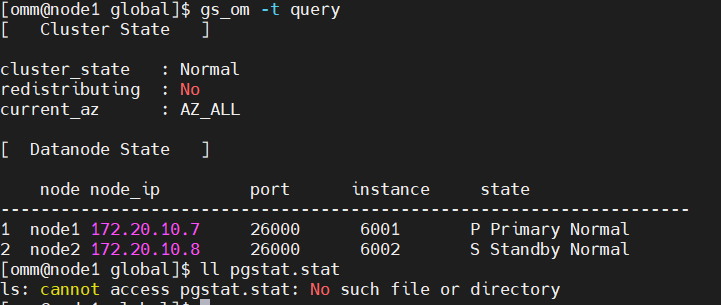
數據目錄的/global下在數據庫stop之后會自動生成一個pgstat.stat文件。保存著DBE_PERF_Schema下query記錄statement相關的dbe_perf.Statement(獲得當前節點的執行語句(歸一化SQL)的信息。查詢視圖必須具有sysadmin權限。
數據庫主節點上可以看到此數據庫主節點接收到的歸一化的SQL的全量統計信息(包含數據庫節點);數據庫節點上僅可看到歸一化的SQL的此節點執行的統計信息)、dbe_perf.STATEMENT_WLMSTAT_COMPLEX_RUNTIME(STATEMENT_WLMSTAT_COMPLEX_RUNTIME視圖顯示和當前用戶執行作業正在運行時的負載管理相關信息)視圖靜態記錄。在數據庫拉起后文件自動清理。
一、Statement所有相關的視圖有:
select count(*) from dbe_perf.Statement;
select count(*) from dbe_perf.STATEMENT_COUNT;
select count(*) from dbe_perf.GLOBAL_STATEMENT_COUNT;
select count(*) from dbe_perf.SUMMARY_STATEMENT_COUNT;
select count(*) from dbe_perf.GLOBAL_STATEMENT_COMPLEX_HISTORY;
select count(*) from dbe_perf.GLOBAL_STATEMENT_COMPLEX_HISTORY_TABLE;
select count(*) from dbe_perf.GLOBAL_STATEMENT_COMPLEX_RUNTIME;
select count(*) from dbe_perf.STATEMENT_RESPONSETIME_PERCENTILE;
select count(*) from dbe_perf.STATEMENT_COMPLEX_RUNTIME;
select count(*) from dbe_perf.STATEMENT_COMPLEX_HISTORY_TABLE;
select count(*) from dbe_perf.STATEMENT_COMPLEX_HISTORY;
select count(*) from dbe_perf.STATEMENT_WLMSTAT_COMPLEX_RUNTIME;
驗證情況如下,從現象看只有dbe_perf.Statement、dbe_perf.STATEMENT_WLMSTAT_COMPLEX_RUNTIME受影響。
二、第一輪測試
select count(*) from dbe_perf.Statement;
-------
    47
(1 row)

postgres=# select count(*) from dbe_perf.STATEMENT_COUNT;
 count
-------
     4
(1 row)

postgres=# select count(*) from dbe_perf.GLOBAL_STATEMENT_COUNT;
 count
-------
     4
(1 row)

postgres=# select count(*) from dbe_perf.SUMMARY_STATEMENT_COUNT;
 count
-------
     4
(1 row)

postgres=# select count(*) from dbe_perf.GLOBAL_STATEMENT_COMPLEX_HISTORY;
 count
-------
     0
(1 row)

postgres=# select count(*) from dbe_perf.GLOBAL_STATEMENT_COMPLEX_HISTORY_TABLE;
 count
-------
     0
(1 row)

postgres=# select count(*) from dbe_perf.GLOBAL_STATEMENT_COMPLEX_RUNTIME;
 count
-------
     0
(1 row)

postgres=# select count(*) from dbe_perf.STATEMENT_RESPONSETIME_PERCENTILE;
 count
-------
     1
(1 row)

postgres=# select count(*) from dbe_perf.STATEMENT_COMPLEX_RUNTIME;
 count
-------
     0
(1 row)

postgres=# select count(*) from dbe_perf.STATEMENT_COMPLEX_HISTORY_TABLE;
 count
-------
     0
(1 row)

postgres=# select count(*) from dbe_perf.STATEMENT_COMPLEX_HISTORY;
 count
-------
     0
(1 row)

postgres=# select count(*) from dbe_perf.STATEMENT_WLMSTAT_COMPLEX_RUNTIME;
 count
-------
     9
(1 row)
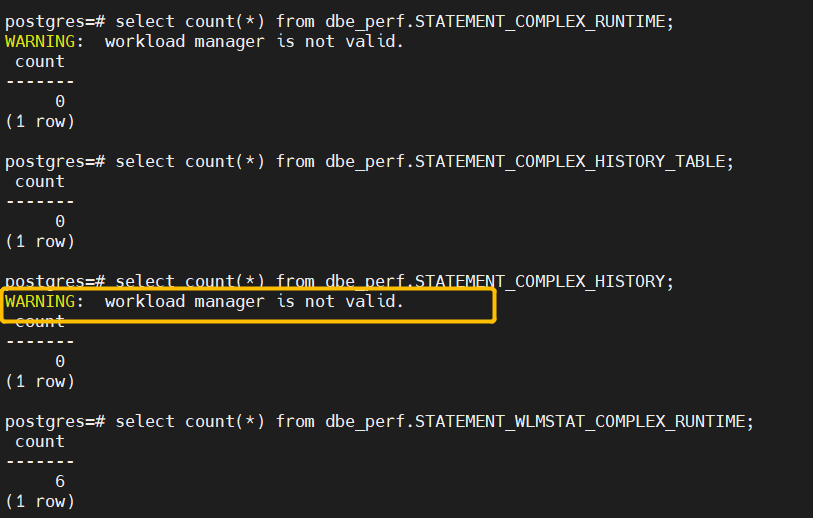
可能會報 WARNING: workload manager is not valid.,需要將use_workload_manager參數打開,該參數表示是否開啟資源管理功能。
use_workload_manager參數由off變為on狀態后,不會統計off時的存儲資源。如果需要統計off時用戶使用的存儲資源,請在數據庫中執行以下命令:select gs_wlm_readjust_user_space(0);
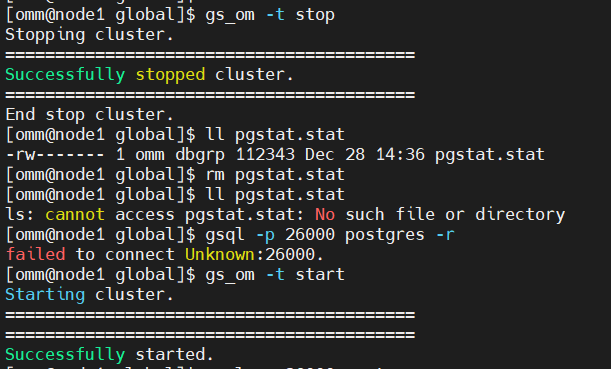
Stop?庫后,刪除pgstat.stat文件后再次查詢
postgres=# select count(*) from dbe_perf.Statement;
count
-------
27
(1 row)
postgres=# select count(*) from dbe_perf.STATEMENT_COUNT;
count
-------
4
(1 row)
postgres=# select count(*) from dbe_perf.GLOBAL_STATEMENT_COUNT;
count
-------
4
(1 row)
postgres=# select count(*) from dbe_perf.SUMMARY_STATEMENT_COUNT;
count
-------
4
(1 row)
postgres=# select count(*) from dbe_perf.GLOBAL_STATEMENT_COMPLEX_HISTORY;
count
-------
0
(1 row)
postgres=# select count(*) from dbe_perf.GLOBAL_STATEMENT_COMPLEX_HISTORY_TABLE;
count
-------
0
(1 row)
postgres=# select count(*) from dbe_perf.GLOBAL_STATEMENT_COMPLEX_RUNTIME;
count
-------
0
(1 row)
postgres=# select count(*) from dbe_perf.STATEMENT_RESPONSETIME_PERCENTILE;
count
-------
1
(1 row)
postgres=# select count(*) from dbe_perf.STATEMENT_COMPLEX_RUNTIME;
count
-------
0
(1 row)
postgres=# select count(*) from dbe_perf.STATEMENT_COMPLEX_HISTORY_TABLE;
count
-------
0
(1 row)
postgres=# select count(*) from dbe_perf.STATEMENT_COMPLEX_HISTORY;
count
-------
0
(1 row)
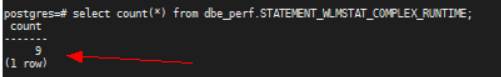
postgres=# select count(*) from dbe_perf.STATEMENT_WLMSTAT_COMPLEX_RUNTIME;
count
-------
9
(1 row)
第一輪里看到dbe_perf.Statement在刪除pgstat.stat后數量從47變成了27.
三、第二輪測試
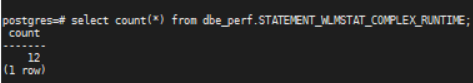
第二輪測試,發現dbe_perf.STATEMENT_WLMSTAT_COMPLEX_RUNTIME的信息也受到了影響