


2022年某周六0點已過剛剛入睡,突然被電話鈴聲驚醒,猛著坐起來條件反射肯定又故障了,這也許就是IT人為什么心臟老出問題的原因,最近幾年電話恐懼癥越來越嚴重,問了一下值班同事處理進度,已經在看了,要了一個我們的數據庫監控圖,有套數據庫hang住了,負載還在增加,看了db alert和等待event, 對于oracle RAC數據庫架構處理起來還是比較方便, 如果是拼架構幾個組件搞起的分布式,我想可能要排查一陣, 下面簡單回溯。
先看一下我們監控數據
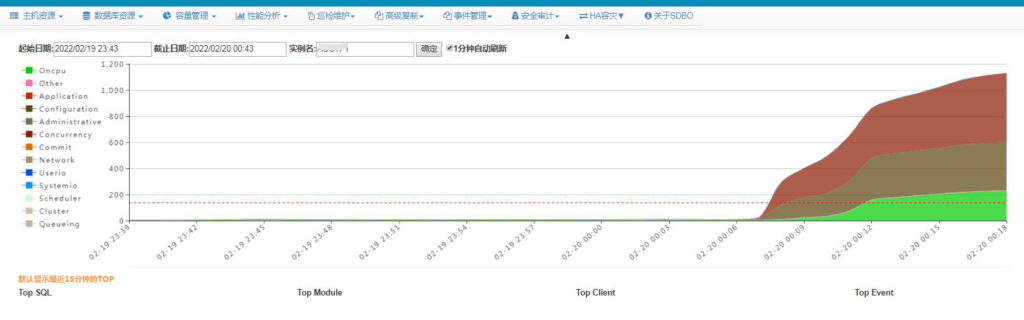
從0:07左右數據庫出現較高的wait event, application和configuration類,做個hangmanager dump,查看db alert log。
HANGMANGER DUMP
===============================================================================

===============================================================================

Chains most likely to have caused the hang:
 [a] Chain 1 Signature: 'rdbms ipc message'<='log file switch (archiving needed)'<='library cache lock'
     Chain 1 Signature Hash: 0xdd234c1e
 [b] Chain 2 Signature: 'ASM background timer'<='enq: DD - contention'
     Chain 2 Signature Hash: 0xa0b18477
 [c] Chain 3 Signature: 'rdbms ipc message'<='log file switch (archiving needed)'
     Chain 3 Signature Hash: 0xfc07a352

===============================================================================
Non-intersecting chains:

-------------------------------------------------------------------------------
Chain 1:
-------------------------------------------------------------------------------
    Oracle session identified by:
    {
  ...
             module name: 0 (oracle@lxxx (TNS V1-V3))1-V3))1-V3)-V3)V3))
    }
    is waiting for 'library cache lock' with wait info:
    {
                      p1: 'handle address'=0x8dfbbcb90
                      p2: 'lock address'=0x6089e6810
                      p3: '100*mode+namespace'=0x7f0002
                    Name: 301   [Nsp: 127 Typ: 255 Id: 0]
            time in wait: 9 min 51 sec
           timeout after: 5 min 8 sec
                 wait id: 19
                blocking: 0 sessions
          current sql_id: 0
             current sql:
             short stack: ksedsts()+426<-ksdxfstk()+58<-ksdxcb()+872<-sspuser()+200<-__sighandler()<-semtimedop()+10<-skgpwwait()+192<-ksliwat()+2192<-kslwaitctx()+200<-kjusuc()+5742<-ksipgetctxia()+1968<-ksixpgetia()+124<-kqlmLock()+1056<-kqlmClusterLock()+1092<-kgllkal()+1904<-kglLock()+1406<-kglget()+293<-kziaRetrieveLSLT()+298<-kpolnb()+2870<-kpoauth()+1805<-opiodr()+1202<-ttcpip()+1222<-opitsk()+1900<-opiino()+936<-opiodr()+1202<-opidrv()+1094<-sou2o()+165<-opimai_real()+422<-ssthrdmain()+417<-main()+256<-__libc_start_main()+245 wait history: * time between current wait and wait #1: 0.004049 sec 1. event: 'PGA memory operation' time waited: 0.000007 sec wait id: 18 p1: ''=0x20000 p2: ''=0x1 * time between wait #1 and #2: 0.000645 sec 2. event: 'PGA memory operation' time waited: 0.000005 sec wait id: 17 p1: ''=0x20000 p2: ''=0x2 * time between wait #2 and #3: 0.000108 sec 3. event: 'PGA memory operation' time waited: 0.000002 sec wait id: 16 p1: ''=0x20000 p2: ''=0x1 } and is blocked by => Oracle session identified by:
    {
        ...
             module name: 0 (oracle@lxxx2 (TNS V1-V3)5-20 (TNS V1-V3)V3))
    }
    which is waiting for 'log file switch (archiving needed)' with wait info:
    {
            time in wait: 1 min 59 sec (last interval)
            time in wait: 62 min 29 sec (total)
           timeout after: never
                 wait id: 19
                blocking: 461 sessions
          current sql_id: 2679977578
             current sql: update user$ set spare6=DECODE(to_char(:2, 'YYYY-MM-DD'), '0000-00-00', to_date(NULL), :2) where user#=:1
             short stack: ksedsts()+426<-ksdxfstk()+58<-ksdxcb()+872<-sspuser()+200<-__sighandler()<-semtimedop()+10<-skgpwwait()+192<-ksliwat()+2192<-kslwaitctx()+200<-kcrfws()+585<-kcbchg1_main()+24041<-kcbchg1()+205<-ktuchg2()+1610<-ktbchg2()+231<-kddchg()+611<-kduovw()+3544<-kduurp()+619<-kdusru()+1370<-kauupd()+356<-updrow()+1699<-qerupUpdRow()+671<-qerupFetch()+595<-updaul()+1416<-updThreePhaseExe()+340<-updexe()+443<-opiexe()+11927<-kpoal8()+2387<-opiodr()+1202<-kpoodrc()+40<-rpiswu2()+2004<-kpoodr()+660<-upirtrc()+2760<-kpurcsc()+1 wait history: * time between current wait and wait #1: 0.000000 sec 1. event: 'latch: redo writing' time waited: 0.006131 sec wait id: 367 p1: 'address'=0x6006d480 p2: 'number'=0x16f p3: 'why'=0x36d2 * time between wait #1 and #2: 0.000000 sec 2. event: 'log file switch (archiving needed)' time waited: 0.100037 sec (last interval) time waited: 60 min 29 sec (total) wait id: 19 * time between wait #2 and #3: 0.000000 sec 3. event: 'latch: redo writing' time waited: 0.003541 sec wait id: 366 p1: 'address'=0x6006d480 p2: 'number'=0x16f p3: 'why'=0x36d2 } and is blocked by => Oracle session identified by:
    {
                instance: 1 (anbob.anbob1)
                   os id: 35330
              process id: 72, oracle@xxx1 (LGWR)
              session id: 15913
        session serial #: 40991
    }
    which is waiting for 'rdbms ipc message' with wait info:
    {
                      p1: 'timeout'=0x115
            time in wait: 0.024259 sec
           timeout after: 2.745741 sec
                 wait id: 3003761110
                blocking: 1258 sessions
          current sql_id: 0
             current sql:
             short stack: ksedsts()+426<-ksdxfstk()+58<-ksdxcb()+872<-sspuser()+200<-__sighandler()<-semtimedop()+10<-skgpwwait()+192<-ksliwat()+2192<-kslwaitctx()+200<-ksarcv()+320<-ksbabs()+602<-ksbrdp()+1123<-opirip()+541<-opidrv()+581<-sou2o()+165<-opimai_real()+173<-ssthrdmain()+417<-main()+256<-__libc_start_main()+245
            wait history:
              * time between current wait and wait #1: 0.000017 sec
              1.       event: 'control file sequential read'
                 time waited: 0.000477 sec
                     wait id: 3003761109       p1: 'file#'=0x0
                                               p2: 'block#'=0x2d
                                               p3: 'blocks'=0x1
              * time between wait #1 and #2: 0.000003 sec
              2.       event: 'control file sequential read'
                 time waited: 0.000559 sec
                     wait id: 3003761108       p1: 'file#'=0x0
                                               p2: 'block#'=0x349
                                               p3: 'blocks'=0x1
              * time between wait #2 and #3: 0.000007 sec
              3.       event: 'control file sequential read'
                 time waited: 0.000449 sec
                     wait id: 3003761107       p1: 'file#'=0x0
                                               p2: 'block#'=0x2b
                                               p3: 'blocks'=0x1
    }

Chain 1 Signature: 'rdbms ipc message'<='log file switch (archiving needed)'<='library cache lock'
Chain 1 Signature Hash: 0xdd234c1e
-------------------------------------------------------------------------------

-------------------------------------------------------------------------------
Chain 2:
-------------------------------------------------------------------------------
    Oracle session identified by:
    {
                instance: 1 (anbob.anbob1)
                   os id: 78749
              process id: 3400, oracle@xxx1 (ARC1)
              session id: 30
        session serial #: 60244
    }
    is waiting for 'enq: DD - contention' with wait info:
    {
                      p1: 'name|mode'=0x44440004
                      p2: 'disk group'=0x1
                      p3: 'type'=0x1
            time in wait: 2 min 36 sec
           timeout after: never
                 wait id: 238720
                blocking: 0 sessions
          current sql_id: 0
             current sql:
             short stack: ksedsts()+426<-ksdxfstk()+58<-ksdxcb()+872<-sspuser()+200<-__sighandler()<-semtimedop()+10<-skgpwwait()+192<-ksliwat()+2192<-kslwaitctx()+200<-ksqcmi()+21656<-ksqgtlctx()+6620<-ksqgelctx()+838<-kfgscAcquireLcl()+1207<-kfgUseGrp()+332<-kfgUse()+760<-kfasOpen()+420<-kfioAchk()+111<-ksfdachk()+123<-krse_arc_dest_init()+5217<-krse_arc_driver_core()+768<-krse_arc_driver()+570<-krse_arc_normal()+1348<-krse_arc_worker()+492<-krss_work_do_one()+161<-kcrrwkx()+575<-kcrrwk()+470<-ksb_act_run_int()+117<-ksb_act_run()+130<-ks wait history: * time between current wait and wait #1: 0.000080 sec 1. event: 'control file sequential read' time waited: 0.001333 sec wait id: 238719 p1: 'file#'=0xffffffff p2: 'block#'=0xb3d p3: 'blocks'=0x40 * time between wait #1 and #2: 0.000004 sec 2. event: 'control file sequential read' time waited: 0.000539 sec wait id: 238718 p1: 'file#'=0x0 p2: 'block#'=0x8f5 p3: 'blocks'=0x1 * time between wait #2 and #3: 0.000007 sec 3. event: 'control file sequential read' time waited: 0.000724 sec wait id: 238717 p1: 'file#'=0x0 p2: 'block#'=0x884 p3: 'blocks'=0x1 } and is blocked by => Oracle session identified by:
    {
                instance: 1 (anbob.anbob1)
                   os id: 35520
              process id: 97, oracle@lxxx1 (ASMB)
              session id: 21438
        session serial #: 23576
    }
    which is waiting for 'ASM background timer' with wait info:
    {
            time in wait: 1.457833 sec
           timeout after: never
                 wait id: 20558055
                blocking: 3 sessions
          current sql_id: 0
             current sql:
             short stack: ksedsts()+426<-ksdxfstk()+58<-ksdxcb()+872<-sspuser()+200<-__sighandler()<-read()+14<-sntpread()+28<-ntpfprd()+126<-nsbasic_brc()+399<-nioqrc()+438<-ttcdrv()+25174<-nioqwa()+61<-upirtrc()+1536<-upirtr()+165<-OCIPDispatch()+176<-kfnOpExecuteWithWaitInt()+1941<-kfnOpExecuteWithWait()+1743<-kfnbRun()+2173<-ksbrdp()+1123<-opirip()+541<-opidrv()+581<-sou2o()+165<-opimai_real()+173<-ssthrdmain()+417<-main()+256<-__libc_start_main()+245
            wait history:
              * time between current wait and wait #1: 0.000011 sec
              1.       event: 'ASM file metadata operation'
                 time waited: 0.000039 sec
                     wait id: 20558054         p1: 'msgop'=0xc
                                               p2: 'locn'=0x3
              * time between wait #1 and #2: 0.000017 sec
              2.       event: 'ASM background timer'
                 time waited: 1.283145 sec
                     wait id: 20558053
              * time between wait #2 and #3: 0.000003 sec
              3.       event: 'ASM file metadata operation'
                 time waited: 0.000018 sec
                     wait id: 20558052         p1: 'msgop'=0xc
                                               p2: 'locn'=0x3
    }

Chain 2 Signature: 'ASM background timer'<='enq: DD - contention'
Note:
看到大量應用進程是被LGWR進程堵塞了,等待事件log file switch (archiving needed)也就是在log file切換時需要歸檔,而歸檔進程arc1是補ASMB進程堵塞,等待時間enq: DD – contention,p1是ASM diskgroup 1,也就是歸檔空間, 而ASM在進行元數據操作, 這時當然就要查下歸檔空間是不是full了,查詢v$asm_diskgroup 掛起,《Troubleshooting query v$asm_disk v$asm_diskgroup hang》我之前筆記提到過我們可以通過查詢v$asm_diskgroup_stats,發現空間還有幾TB free,不是歸檔空間不足問題。 接下來看db alert log.
DB alert LOG
2022-02-19 21:49:58.929000 +08:00
Thread 1 advanced to log sequence 14029 (LGWR switch),  current SCN: 17336239867641
  Current log# 1 seq# 14029 mem# 0: +DATADG/anbob/ONLINELOG/group_1.1369.1082047011
2022-02-19 21:50:00.577000 +08:00
TT02 (PID:51673): SRL selected for T-1.S-14029 for LAD:2
2022-02-19 21:50:04.342000 +08:00
ARC1 (PID:50185): Archived Log entry 91445 added for T-1.S-14028 ID 0xf16c68a8 LAD:1
2022-02-19 22:09:43.690000 +08:00
SUCCESS: diskgroup ARCHDG was dismounted
2022-02-19 22:17:04.978000 +08:00
Thread 1 advanced to log sequence 14030 (LGWR switch),  current SCN: 17336272315815
  Current log# 2 seq# 14030 mem# 0: +DATADG/anbob/ONLINELOG/group_2.1370.1082047019
NOTE: ASMB mounting group 1 (ARCHDG)
NOTE: Assigned CGID 0x10506 for group 1
NOTE: ASMB process initiating disk discovery for grp 1 (reqid:0)
2022-02-19 22:17:06.704000 +08:00
TT02 (PID:51673): SRL selected for T-1.S-14030 for LAD:2
2022-02-19 22:20:15.068000 +08:00
NOTE: disk group discovery running slower than expected, ASMB diagnostic requested after 189 seconds
2022-02-19 22:20:18.451000 +08:00
NOTE: ASMB process state dumped to trace file /oracle/app/oracle/diag/rdbms/anbob/anbob1/trace/anbob1_arc2_50187.trc
2022-02-19 22:21:34.537000 +08:00
TMON (PID:36555): Process (PID:50187) hung on an I/O to LAD:1 after 269 seconds with threshold of 240 at [krse.c:8941]
TMON (PID:36555): WARN: Terminating process hung on an operation (PID:50187)
2022-02-19 22:21:40.632000 +08:00
TMON (PID:36555): Killing 1 processes (PIDS:50187) (Process by index) in order to remove hung processes. Requested by OS process 36555 on instance 1
Process termination requested for pid 50187 [source = rdbms], [info = 2] [request issued by pid: 36555, uid: 1010]
2022-02-19 22:21:42.641000 +08:00
TMON (PID:36555): Error 16198 due to hung I/O operation to LOG_ARCHIVE_DEST_1
TMON (PID:36555): Detected ARCH process failure
TMON (PID:36555): STARTING ARCH PROCESSES
Starting background process ARC2
ARC2 started with pid=125, OS id=56813
TMON (PID:36555): ARC2: Archival started
TMON (PID:36555): STARTING ARCH PROCESSES COMPLETE
2022-02-19 22:31:12.696000 +08:00
TMON (PID:36555): Process (PID:50178) hung on an I/O to LAD:1 after 246 seconds with threshold of 240 at [krsi.c:11798]
TMON (PID:36555): WARN: Terminating process hung on an operation (PID:50178)
2022-02-19 22:31:18.797000 +08:00
TMON (PID:36555): Killing 1 processes (PIDS:50178) (Process by index) in order to remove hung processes. Requested by OS process 36555 on instance 1
Process termination requested for pid 50178 [source = rdbms], [info = 2] [request issued by pid: 36555, uid: 1010]
2022-02-19 22:31:20.801000 +08:00
TMON (PID:36555): Error 16198 due to hung I/O operation to LOG_ARCHIVE_DEST_1
2022-02-19 22:31:50.830000 +08:00
...
...
...
opiodr aborting process unknown ospid (65797) as a result of ORA-609
2022-02-20 01:17:18.838000 +08:00
.... (PID:47714): Using STANDBY_ARCHIVE_DEST parameter default value as +DATADG [krsd.c:18141]
ALTER SYSTEM SET log_archive_dest_1='LOCATION=+DATADG' SCOPE=BOTH;
2022-02-20 01:17:22.447000 +08:00
ARC1 (PID:57013): Archived Log entry 91480 added for T-1.S-14030 ID 0xf16c68a8 LAD:1
Thread 1 advanced to log sequence 14035 (LGWR switch),  current SCN: 17336448584151
Error stack returned to user:
注意:
22:09 歸檔所在的ARCHDG 被dismount了, 22:17在log file switch時觸發了自動mount歸檔ARCHDG(group 1), 但是在ASMB process initiating disk discovery 在根據asm_diskstring配置掃描設備時hang住, 隨后12C后的新增加的后臺進程TMON也監控到了DG同步進程TT00 hang, 當前的DG是異步模式. 因為它要解決GAP,從歸檔目錄讀取日志,hung I/O operation to LOG_ARCHIVE_DEST_1 所以也受歸檔目錄的影響。 后來我們更改了歸檔的ASM Diskgroup到DATADG后恢復正常,日志可以正常切換。
Why ARCHDG DISMOUNT?
為什么archdg無人干預它會DISMOUNT? 需要查看ASM ALERT LOG。
2021-12-22T10:20:41.290848+08:00
SQL> alter diskgroup BAKDG dismount
2021-12-22T10:20:41.292702+08:00
NOTE: client anbob1:anbob:lxxxx-cluster no longer has group 6 (BAKDG) mounted
NOTE: client anbob1:anbob:lxxxx-cluster no longer has group 5 (LOGDG) mounted
NOTE: client anbob1:anbob:lxxxx-cluster no longer has group 1 (ARCHDG) mounted
...
2022-02-19T22:09:43.688790+08:00
SQL> alter diskgroup LOGDG dismount force
2022-02-19T22:09:43.690580+08:00
NOTE: client anbob1:anbob:lxxxx-cluster no longer has group 1 (ARCHDG) mounted
2022-02-19T22:09:45.698928+08:00
NOTE: cache dismounting (not clean) group 5/0xC2A04DC2 (LOGDG)
NOTE: messaging CKPT to quiesce pins Unix process pid: 49035, image: oracle@xxxx1 (TNS V1-V3)
2022-02-19T22:09:45.700874+08:00
NOTE: halting all I/Os to diskgroup 5 (LOGDG)
...
ASM instance parameter About disk discovery
asm_diskstring=/dev/asm*, /dev/cdm*
NOTE:
可以看到ARCHDG前有顯示發起logdg dismount force命令, 提示到了archdg, 之前dismount別的ASMDG 也有dismount 其它ASM diskgroup現象, 這是oracle的預期形為。
If a ASM diskgroup is dismounted on a ASM instance, then connected DB instances receive a message from the ASM instance, and DB instances will “dismount” the ASM diskgroup(s) not being used (i.e. no reference).
But this “dismount” dose not affect the actual diskgroup status at ASM side, and it is more like a disconnect opertaion from DB instances to the diskgroup(s).The diskgroup(s) will be mounted again automatically when the DB instances use them(it) again.
Note:
這里就明白了ARCHDG是因為前面執行了LOGDG dismount, 而這操作又是某大廠的備份軟件發起,但并不是它預期的。但是也有提到如果diskgroup使用時又會自動mount,這里為什么沒有mount?
ARC2 dump trace
上面看到mount時會discovery掃描asm_diskstring匹配的所有設備,ASMB進程發現了問題,并生成了dump文件arc2 trace.
*** TRACE FILE RECREATED AFTER BEING REMOVED ***

NOTE: disk group discovery running slower than expected, ASMB diagnostic requested after 189 seconds
----- Abridged Call Stack Trace -----
ksedsts()+426<-kfnDiagASMB()+720<-kfgbWaitForDiscovery()+321<-kfgCreate()+2977<-kfgUse()+2195<-kfasOpen()+420<-kfioAchk()+111<-ksfdachk()+123<-krse_arc_dest_init()+5217<-krse_arc_driver_core()+768<-krse_arc_driver()+570<-krse_arc_normal()+1348<-krse_arc_worker()+492
<-krss_work_do_one()+161<-kcrrwkx()+575<-kcrrwk()+470<-ksb_act_run_int()+117<-ksb_act_run()+130<-ksbabs()+746<-ksbrdp()+1123<-opirip()+541<-opidrv()+581<-sou2o()+165<-opimai_real()+173<-ssthrdmain()+417<-main()+256<-__libc_start_main()+245


########  查看CALL STACK函數調用 ######
Discovered stack type: short stack
Parsed short stack:
ksedsts()+426                  kernel service error debug dump the call stack short stack
kfnDiagASMB()+720              kernel automatic storage management networking subsystem  [partial hit for: kfn ]
kfgbWaitForDiscovery()+321     kernel automatic storage management diskgroups background wait for disk Discovery  [partial hit for: kfgb ]
kfgCreate()+2977               kernel automatic storage management diskgroups  [partial hit for: kfg ]
kfgUse()+2195                  kernel automatic storage management diskgroups  [partial hit for: kfg ]
kfasOpen()+420                 kernel automatic storage management alias operations  [partial hit for: kfa ]
kfioAchk()+111                 kernel automatic storage management translation IO layer  [partial hit for: kfio ]
ksfdachk()+123                 kernel service functions disk IO  [partial hit for: ksfd ]
krse_arc_dest_init()+5217      kernel redo standby/dataguard (?) archive engine  [partial hit for: krse ]
krse_arc_driver_core()+768     kernel redo standby/dataguard (?) archive engine  [partial hit for: krse ]
krse_arc_driver()+570          kernel redo standby/dataguard (?) archive engine  [partial hit for: krse ]
krse_arc_normal()+1348         kernel redo standby/dataguard (?) archive engine  [partial hit for: krse ]
krse_arc_worker()+492          kernel redo standby/dataguard (?) archive engine  [partial hit for: krse ]
krss_work_do_one()+161         kernel redo standby/dataguard (?) scheduler  [partial hit for: krss ]
kcrrwkx()+575                  kernel cache recovery redo archival  [partial hit for: kcrr ]
kcrrwk()+470                   kernel cache recovery redo archival  [partial hit for: kcrr ]
ksb_act_run_int()+117          kernel service background processes  [partial hit for: ksb ]
ksb_act_run()+130              kernel service background processes  [partial hit for: ksb ]
ksbabs()+746                   kernel service background processes action based server
ksbrdp()+1123                  kernel service background processes run a detached background process
注意
也是在ASM DISKGROUP的掃描過程中,難道是其中某個設備有問題?這時可以使用kfed或dd等工具遍歷讀一下盤頭。
“D” state process
遍歷盤時發現了/dev/cdm的某個盤讀取時,進程會hang住。主機工程師發現監控fdisk -l 也都掛起,使用strace 跟蹤發現在open /dev/sded設備。上面也有提到我們的v$asm_diskgroup查詢也hang,看一下進程狀態。
SQL> oradebug setospid 49987
Oracle pid: 38, Unix process pid: 49987, image: oracle@hostxx (TNS V1-V3)
SQL> oradebug short_stack
^CORA-01013: user requested cancel of current operation

grid@hostxx:/home/grid> ps -elf |grep 49987|grep -v grep
0 D grid      49987      1  0  80   0 - 1159845 disk_b Feb19 ?      00:00:00 oracle+ASM1_user49942_anbob1 (DESCRIPTION=(LOCAL=YES)(ADDRESS=(PROTOCOL=beq)))

ps -elf|head -1;ps -elf|awk '{if($2=="D"){print $0}}'
F S UID         PID   PPID  C PRI  NI ADDR SZ WCHAN  STIME TTY          TIME CMD
0 D grid      15763      1  0  80   0 - 1159915 disk_b 01:41 ?      00:00:00 oracle+ASM1_user125496_anbob1 (DESCRIPTION=(LOCAL=YES)(ADDRESS=(PROTOCOL=beq)))
0 D grid      16328      1  0  80   0 - 1161681 disk_b 2021 ?       04:28:38 asm_ppa7_+ASM1
0 D root      51989      1  0  80   0 - 28827 flush_ Feb19 ?        00:00:00 sh -c echo 1 > /sys/block/sded/device/delete
4 D root      52261  52223  0  80   0 - 28129 disk_b 06:08 ?        00:00:00 /sbin/fdisk -l
4 D root      35259  35231  0  80   0 - 28129 disk_b 09:22 ?        00:00:00 /sbin/fdisk -l
0 D oracle    35496      1  0  80   0 - 79027345 disk_b Jan11 ?     00:01:44 ora_rbal_acctf1
4 D root      53075  53062  0  80   0 - 28129 disk_b 08:08 ?        00:00:00 /sbin/fdisk -l
0 D grid      53744      1  0  80   0 - 1159321 disk_b 02:46 ?      00:00:00 asm_ppa6_+ASM1
4 D root      54695  54689  0  80   0 - 28129 disk_b 04:04 ?        00:00:00 /sbin/fdisk -l
4 D root      84818  10059  0  80   0 - 42177 disk_b 01:29 ?        00:00:00 pvs
4 D root      85287  85272  0  80   0 - 28129 disk_b 04:56 ?        00:00:00 /sbin/fdisk -l
4 D root      86738  86711  0  80   0 - 28129 disk_b 09:13 ?        00:00:00 /sbin/fdisk -l
...
Note:
可以看到查詢進程還有ASM rbal 后臺進程也都處理”D” 內核態,這種都是無法通過kill 終止的,同時還有sded設備的delete也被掛起。
查看OS message
22:09:48 xxx iscsid connect to xx.xxx.xxx.xxx failed (connection refused)
22:09:51 xxx  iscsid could not online LUN 25 err 5
為了遍歷所有設備我搞了個小SHELL
oracle@ldxxx1:/home/oracle> ls -l /dev/asm*

lrwxrwxrwx 1 root root       4 Feb 21 16:00 /dev/asm-disk10 -> sdaw
lrwxrwxrwx 1 root root       4 Feb 21 16:00 /dev/asm-disk11 -> sdax
lrwxrwxrwx 1 root root       3 Feb 21 16:14 /dev/asm-disk13 -> sde
...

oracle@ldxxx1:/home/oracle> ls -l /dev/cdm*
brw-rw---- 1 grid asmadmin  67, 128 Jan 25 16:08 /dev/cdm-arch-disk1
brw-rw---- 1 grid asmadmin  67, 160 Jan 22 16:15 /dev/cdm-arch-disk2
brw-rw---- 1 grid asmadmin  67, 192 Jan 22 04:17 /dev/cdm-arch-disk3
brw-rw---- 1 grid asmadmin 128,  80 Feb 19 22:09 /dev/cdm-arch-disk5
...

ls -l /dev/asm*|awk '{print $11}'|while read LINE;
do
echo "checking /dev/$LINE";
EXISTS=`lsscsi |grep -w /dev/$LINE|wc -l`
if  [ "$EXISTS" -eq "1" ]
then
echo  "ok"
else
echo "missing "
fi;
done;

ls -l /dev/cdm*|awk '{printf "%3s %3s\n",$5,$6  }'| while read LINE;
do
echo "======  checking device No. $LINE   ====="
CNT=`ls -l /dev/*|grep "$LINE"|wc -l `
DEV=`ls -l /dev/sd*|grep "$LINE"|awk '{print $10}'`

if  [ "$CNT" -gt "2" ]
then
echo  "**** duplicat path"
fi;

echo $DEV
EXISTS=`lsscsi -k |grep -w $DEV|wc -l`
if  [ "$EXISTS" -eq "1" ]
then
echo  "ok"
else
echo "*********** missing *************"
ls -l /dev/*|grep "$LINE"
fi;
done;
-- 部分輸出 --
======  checking device No. 128,  80   =====
/dev/sded
*********** missing *************
brw-rw----    1 grid asmadmin 128,  80 Feb 19 22:09 /dev/cdm-arch-disk5
brw-rw----    1 root disk     128,  80 Feb 19 22:09 /dev/sded
======  checking device No. 133,  16   =====
/dev/sdhb
ok
...
Note:
存儲工程師發現了是分布式存儲bug, 導致了數據庫主機的iscsi只有一個盤失敗。而/dev/sded剛好就是/dev/cdm*中的一個設備。
HANG DATETIME
到這里原因都已經明了,那個設備故障是在2個小時前,那為什么數據庫負載是從0點以后呢?相信你應該知道redo 和archivelog的區別
SQL> @log
Show redo log layout from V$LOG and V$LOGFILE...

    GROUP#    THREAD#  SEQUENCE#      BYTES  BLOCKSIZE    MEMBERS ARCHIV STATUS
---------- ---------- ---------- ---------- ---------- ---------- ------ --------------------------------
         1          1      14056 4696571904        512          1 YES    INACTIVE
         2          1      14059 4696571904        512          1 YES    INACTIVE
         3          1      14060 4696571904        512          1 YES    ACTIVE
         4          1      14061 4696571904        512          1 NO     CURRENT
         5          1      14058 4696571904        512          1 YES    INACTIVE
         6          1      14057 4696571904        512          1 YES    INACTIVE
         7          2      31894 4696571904        512          1 YES    INACTIVE
         8          2      31895 4696571904        512          1 YES    INACTIVE
         9          2      31896 4696571904        512          1 YES    INACTIVE
        10          2      31897 4696571904        512          1 YES    INACTIVE
        11          2      31898 4696571904        512          1 YES    INACTIVE
        12          2      31899 4696571904        512          1 NO     CURRENT

SQL> select thread#,sequence#,first_time,next_time,completion_time,(completion_time-next_time)*24*3600
from v$archived_log
where first_time>sysdate-14/24 standby_dest='NO' order by thread#,sequence#;

   THREAD#  SEQUENCE# FIRST_TIME          NEXT_TIME           COMPLETION_TIME     (COMPLETION_TIME-NEXT_TIME)*24*3600
---------- ---------- ------------------- ------------------- ------------------- -----------------------------------
         1      14023 2022-02-19 19:34:13 2022-02-19 19:56:19 2022-02-19 19:56:25                                   6
         1      14024 2022-02-19 19:56:19 2022-02-19 20:17:01 2022-02-19 20:17:07                                   6
         1      14025 2022-02-19 20:17:01 2022-02-19 20:39:07 2022-02-19 20:39:13                                   6
         1      14026 2022-02-19 20:39:07 2022-02-19 21:01:49 2022-02-19 21:01:55                                   6
         1      14027 2022-02-19 21:01:49 2022-02-19 21:25:13 2022-02-19 21:25:19                                   6
         1      14028 2022-02-19 21:25:13 2022-02-19 21:49:58 2022-02-19 21:50:04                                   6
         1      14029 2022-02-19 21:49:58 2022-02-19 22:17:04 2022-02-20 01:20:15                               10991 <<<< 2022-02-19 22:17:04 開始無法歸檔
         1      14030 2022-02-19 22:17:04 2022-02-19 22:46:17 2022-02-20 01:17:22                                9065 <<<<
         1      14031 2022-02-19 22:46:17 2022-02-19 23:14:41 2022-02-20 01:17:25                                7364 <<<<
         1      14032 2022-02-19 23:14:41 2022-02-19 23:42:38 2022-02-20 01:17:27                                5689 <<<<
         1      14033 2022-02-19 23:42:38 2022-02-20 00:00:17 2022-02-20 01:17:25                                4628 <<<<
         1      14034 2022-02-20 00:00:17 2022-02-20 01:17:22 2022-02-20 01:17:37                                  15 <<<< 6個log整好一輪,未歸檔LOG WRITE無法覆蓋REDO
         1      14035 2022-02-20 01:17:22 2022-02-20 01:18:27 2022-02-20 01:18:36                                   9
Note:
我們的ONLINE redo在ASM datadg,一共6組,在無法歸檔時,redo依舊可寫,當所有redo寫了一輪后所有online redo都為ACTIVE,無法覆蓋時掛起,從歸檔歷史記錄可以確認這點。
ASM diskgroup 的asm_diskstring之前有分享過<< ASM Disk Discovery 最佳實踐 >>
Summary:
現在總結一下這個案例,就是因為某大廠的備份軟件在備份前需要修改正常庫的asm_diskstring 增加它的/dev/cdm*, 掛載它的存儲設備到ASMDG, 因為他的軟件bug導致期中一塊盤處于中間態,磁盤名有,但iscsi未注冊,掛載失敗立即執行把它自己的ASMDG卸載,alter diskgroup xx dismount,但是這個動作又觸發了ORACLE的ASM 自動disconnect 其它未使用diskgroup的預期行為,導致archdg dismount,在后面歸檔時需要自動mount archdg, 而diskcovery 掃描asm_diskstring中的/dev/cdm*是hang住,無法掛載ARCHDG導致無法歸檔,最終導致了這個故障。 通過這案例我們學到的是第三方軟件即使是備份軟件最好也不要動生產庫的配置,因為可能無法預期到oracle的一些預期行為,尤其是不成熟的軟件,自己未做異常捕捉和告警產生了這種殘留設備, 數據庫我們可以增加一個監控,監控online redo loggroup中”ACTIVE”狀態的個數,如超過3個里,需要關注。 就到這里。
— enjoy —
