


一、背景
??最近在做數據庫巡檢的時候發現ASH報告里有一個:os thread startup 等待事件,感覺很奇怪,在以前的巡檢的報告中未發現此等待事件,避免數據庫存儲潛在風險。于是做了個分析。
二、事件分析
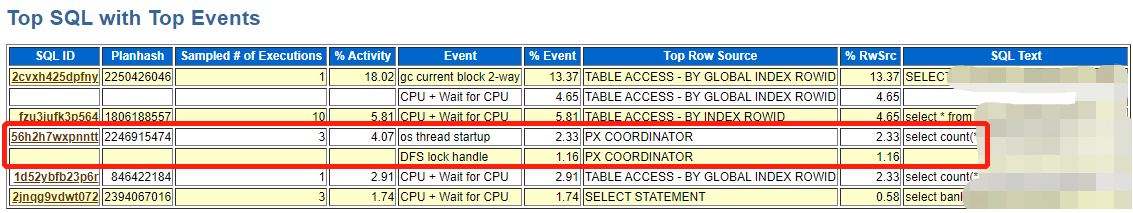
??由SQL_ID:56h2h7wxpnntt引起的,os thread startup 和 DFS lock handle(與序列有關,整個查詢未發現與序列有關,此次先不討論)
??看來與并行有關:PX COORDINATOR
三、查詢資料
os thread startup 是oracle 等待事件中Concurrency的一個等待,在進行并行分配是向os 申請進程啟動,而在正常的系統中,該動作是非常快的,在我們高壓力的數據庫環境下,os存在響應問題,激發了該等待事件的等待。
MOS上的一篇文檔 :
Solaris: database instance hangs intermittently with wait event: ‘os thread startup’ (Doc ID 1909881.1)
‘os thread startup’ indicates some high contention at OS level avoiding even new process startup.
翻譯:
Solaris:數據庫實例間歇性掛起,等待事件:“os thread startup”(文檔ID 1909881.1)
“os thread startup”表示在操作系統級別存在一些高爭用,甚至避免了新進程的啟動。
四、查詢SQL對像的并行度
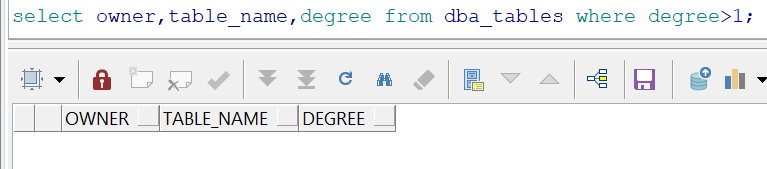
- 表的并行屬性:結果為空
select owner,table_name,degree from dba_tables where degree>1;
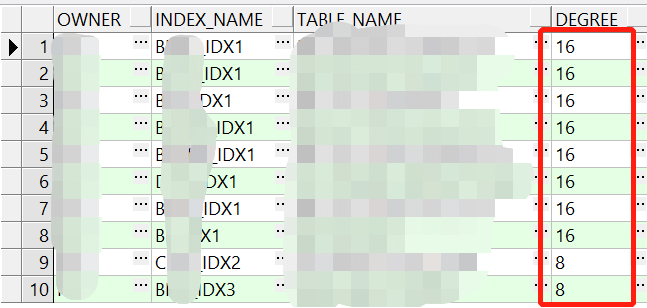
- 索引并行屬性
select owner, index_name, table_name, degree
  from dba_indexes
 where degree > 1;
SQL_ID:56h2h7wxpnntt涉及表的索引的并行度為(8或16),因此表為業務大表,應該是在創建索引的時候加并行了,當時沒注意。
注:并行創建索引完成后,需要調整并行度,避免在使用查詢時數據庫開啟并行,生產OLTP數據庫使用并行存在一定的風險 。如下:
- 重建索引開并行
SQL> alter index t1_idx_id rebuild parallel 4;
Index altered.
SQL> select degree from all_indexes where index_name='T1_IDX_ID';
DEGREE
------------
4
- 索引重建完畢后關閉并行
SQL> alter index T1_IDX_ID noparallel;
Index altered.
SQL> select degree from all_indexes where index_name='T1_IDX_ID';
DEGREE
------------
1
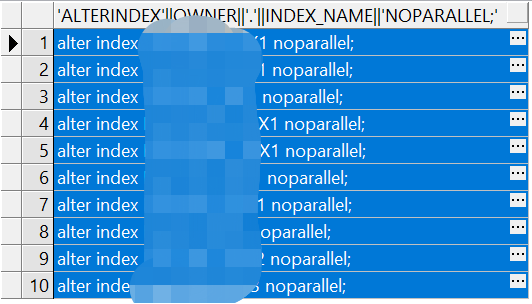
五、關閉索引并行度
select 'alter index '||owner||'.'||index_name||' noparallel;'
  from dba_indexes
 where degree > 1;
六、執行計劃對比:
- 開并行的SQL執行計劃:COST:553
  COUNT(*)
----------
     50997
Elapsed: 00:00:04.46
----------------------------------------------------------------------------------------------------
| Id   | Operation                         | Name              | Rows  | Bytes   | Cost | Time     |
----------------------------------------------------------------------------------------------------
|    0 | SELECT STATEMENT                  |                   |     1 |     100 |  553 | 00:00:07 |
|    1 |   SORT AGGREGATE                  |                   |     1 |     100 |      |          |
|    2 |    PX COORDINATOR                 |                   |       |         |      |          |
|    3 |     PX SEND QC (RANDOM)           | :TQ10003          |     1 |     100 |      |          |
|    4 |      SORT AGGREGATE               |                   |     1 |     100 |      |          |
|    5 |       NESTED LOOPS                |                   | 43978 | 4397800 |  553 | 00:00:07 |
|    6 |        NESTED LOOPS OUTER         |                   | 43978 | 3870064 |  549 | 00:00:07 |
|  * 7 |         HASH JOIN                 |                   | 43978 | 3034482 |  547 | 00:00:07 |
|    8 |          BUFFER SORT              |                   |       |         |      |          |
|    9 |           PX RECEIVE              |                   | 50551 | 1162673 |  444 | 00:00:06 |
|   10 |            PX SEND HASH           | :TQ10001          | 50551 | 1162673 |  444 | 00:00:06 |
| * 11 |             TABLE ACCESS FULL     | A**_***_****T    | 50551 | 1162673 |  444 | 00:00:06 |
|   12 |          PX RECEIVE               |                   | 43979 | 2023034 |   94 | 00:00:02 |
|   13 |           PX SEND HASH            | :TQ10002          | 43979 | 2023034 |   94 | 00:00:02 |
| * 14 |            HASH JOIN              |                   | 43979 | 2023034 |   94 | 00:00:02 |
|   15 |             BUFFER SORT           |                   |       |         |      |          |
|   16 |              PX RECEIVE           |                   |    65 |    1040 |    4 | 00:00:01 |
|   17 |               PX SEND BROADCAST   | :TQ10000          |    65 |    1040 |    4 | 00:00:01 |
| * 18 |                TABLE ACCESS FULL  | B**_*****T        |    65 |    1040 |    4 | 00:00:01 |
|   19 |             PX BLOCK ITERATOR     |                   | 51110 | 1533300 |   81 | 00:00:01 |
|   20 |              INDEX FAST FULL SCAN | B**_IDX1          | 51110 | 1533300 |   81 | 00:00:01 |
| * 21 |         INDEX RANGE SCAN          | D***_IDX1         |     1 |      19 |    0 | 00:00:01 |
| * 22 |        INDEX UNIQUE SCAN          | PK_C***_C***_I*** |     1 |      12 |    0 | 00:00:01 |
----------------------------------------------------------------------------------------------------
Statistics
----------------------------------------------------------
         96  recursive calls
          0  db block gets
      26115  consistent gets
          0  physical reads
          0  redo size
        528  bytes sent via SQL*Net to client
        520  bytes received via SQL*Net from client
          2  SQL*Net roundtrips to/from client
         32  sorts (memory)
          0  sorts (disk)
          1  rows processed
- 去掉并行度后:COST:536
  COUNT(*)
----------
     50997
Elapsed: 00:00:00.21
------------------------------------------------------------------------------------------------
| Id   | Operation                     | Name              | Rows  | Bytes   | Cost | Time     |
------------------------------------------------------------------------------------------------
|    0 | SELECT STATEMENT              |                   |     1 |     100 |  536 | 00:00:07 |
|    1 |   SORT AGGREGATE              |                   |     1 |     100 |      |          |
|    2 |    NESTED LOOPS               |                   | 43978 | 4397800 |  536 | 00:00:07 |
|  * 3 |     HASH JOIN RIGHT OUTER     |                   | 43978 | 3870064 |  532 | 00:00:07 |
|    4 |      INDEX FULL SCAN          | D***_IDX1         |    87 |    1653 |    1 | 00:00:01 |
|  * 5 |      HASH JOIN                |                   | 43978 | 3034482 |  530 | 00:00:07 |
|  * 6 |       TABLE ACCESS FULL       | A**_***_****T     | 50551 | 1162673 |  444 | 00:00:06 |
|  * 7 |       HASH JOIN               |                   | 43979 | 2023034 |   85 | 00:00:02 |
|    8 |        VIEW                   | index$_join$_003  |    65 |    1040 |    3 | 00:00:01 |
|  * 9 |         HASH JOIN             |                   |       |         |      |          |
|   10 |          INDEX FAST FULL SCAN | BK_P*****T_PK     |    65 |    1040 |    1 | 00:00:01 |
| * 11 |          INDEX FAST FULL SCAN | B***_IDX1         |    65 |    1040 |    1 | 00:00:01 |
|   12 |        INDEX FAST FULL SCAN   | B***_IDX1         | 51110 | 1533300 |   81 | 00:00:01 |
| * 13 |     INDEX UNIQUE SCAN         | PK_C***_C***_I*** |     1 |      12 |    0 | 00:00:01 |
------------------------------------------------------------------------------------------------
Statistics
----------------------------------------------------------
          0  recursive calls
          0  db block gets
       2119  consistent gets
          0  physical reads
          0  redo size
        528  bytes sent via SQL*Net to client
        520  bytes received via SQL*Net from client
          2  SQL*Net roundtrips to/from client
          0  sorts (memory)
          0  sorts (disk)
          1  rows processed
查詢時間由原來的:00:00:04.46 降至:00:00:00.21 提高了4秒多。
邏輯讀:26115 降至:2119
遞歸調用:96 降至:0
內存排序:32 降至:0
整體的查詢效率有了很大的提高。
七、總結
1、os thread startup 等待事件一般與并行相關;
2、在創建索引與重建索引加并行時,索引調整完后,需要關閉并行度;
3、從最后的執行計劃來看,并行不一定會使查詢變快,可能會起到相反的作用,OLTP數據庫慎用并行;
?????????????Oracle相關文章推薦
| Oracle: | URL |
|---|---|
| 《Oracle 自動收集統計信息機制》 | http://www.sunline.cc/db/403670 |
| 《Oracle_索引重建—優化索引碎片》 | http://www.sunline.cc/db/399543 |
| 《DBA_TAB_MODIFICATIONS表的刷新策略測試》 | http://www.sunline.cc/db/414692 |
| 《FY_Recover_Data.dbf》 | http://www.sunline.cc/doc/74682 |
| 《Oracle RAC 集群遷移文件操作.pdf》 | http://www.sunline.cc/doc/72985 |
| 《Oracle Date 字段索引使用測試.dbf》 | http://www.sunline.cc/doc/72521 |
| 《Oracle 診斷案例 :因應用死循環導致的CPU過高》 | http://www.sunline.cc/db/483047 |
| 《Oracle 慢SQL監控腳本》 | http://www.sunline.cc/db/479620 |
| 《Oracle 慢SQL監控測試及監控腳本.pdf》 | http://www.sunline.cc/doc/76068 |
| 《Oracle 腳本實現簡單的審計功能》 | http://www.sunline.cc/db/450052 |
| 《記錄一起索引rebuild與收集統計信息的事故》 | http://www.sunline.cc/db/408934 |
| 《RAC DG刪除備庫redo時報ORA-01623》 | http://www.sunline.cc/db/515939 |
