


如今,在Oracle數(shù)據(jù)庫(kù)上有數(shù)T大小的分區(qū)是比較常見(jiàn)的。如果你還沒(méi)遇到,那你也正朝著這個(gè)方向在前進(jìn)。所以,你需要了解如何維護(hù)大表的統(tǒng)計(jì)信息。我將會(huì)通過(guò)如下幾個(gè)貼子來(lái)涵蓋該問(wèn)題:
- 貼子1(本篇)-- 概念和實(shí)現(xiàn)
- 貼子 2 – 增量統(tǒng)計(jì)信息和分區(qū)交換加載
- 貼子 3 – Oracle Database 12c Release 2中的新功能
這里有一些額外的細(xì)節(jié),還有一些在早前優(yōu)化器博客中有所涉及的地方,所以您也可以參考一下。https://blogs.oracle.com/optimizer/entry/maintaining_statistics_on_large_partitioned_tables
概念
分區(qū)表上都有哪些統(tǒng)計(jì)信息?
考慮一個(gè)名為SALES的分區(qū)表,其上有對(duì)應(yīng)財(cái)務(wù)季度1和季度2(Q1和Q2)的日期范圍分區(qū)。分區(qū)在列QUARTER上。數(shù)據(jù)庫(kù)為單獨(dú)的分區(qū)收集了統(tǒng)計(jì)信息,以便可以評(píng)估被裁剪到單個(gè)分區(qū)的查詢的基數(shù)。這被稱之為分區(qū)級(jí)統(tǒng)計(jì)信息。為了用一個(gè)示例來(lái)演示,我計(jì)劃只考慮兩個(gè)統(tǒng)計(jì)信息,而忽略其它。Q1和Q2中分別有600和550行。SALE_TYPE列上的唯一值數(shù)量(NDVs)在Q1中是30,Q2中是50:
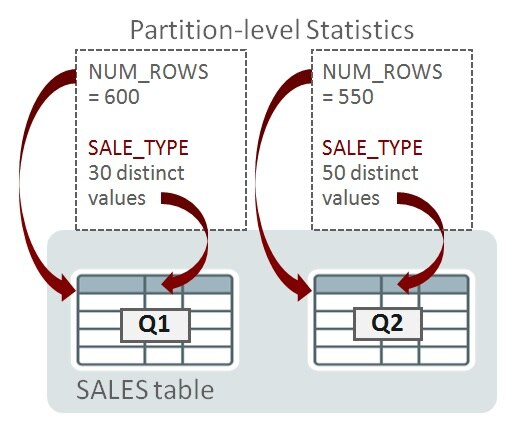
當(dāng)查詢被編譯時(shí),如果優(yōu)化器確定它只需訪問(wèn)單個(gè)分區(qū)(比如,通過(guò)分區(qū)裁剪),那么分區(qū)級(jí)的統(tǒng)計(jì)信息就足夠幫助確定執(zhí)行計(jì)劃。以下是一個(gè)只訪問(wèn)Q1的查詢:
SELECT SUM(amount) FROM sales WHERE quarter = 'Q1' AND sale_type = 'DIRECT';
如果優(yōu)化器在編譯時(shí),確定查詢會(huì)潛在訪問(wèn)一個(gè)以上的分區(qū),那么單獨(dú)的分區(qū)統(tǒng)計(jì)信息就不夠了。在接下來(lái)的例子中,查詢需要訪問(wèn)一個(gè)以上的分區(qū):
SELECT SUM(amount) FROM sales
WHERE  sale_type = 'DIRECT';
對(duì)于可以訪問(wèn)多個(gè)分區(qū)的查詢,優(yōu)化器必須考慮表級(jí)的統(tǒng)計(jì)信息。這些統(tǒng)計(jì)信息稱為全局統(tǒng)計(jì)信息。

你知道,Oracle數(shù)據(jù)庫(kù)可以進(jìn)一步劃分分區(qū)為子分區(qū);即復(fù)合分區(qū)。當(dāng)下,我將只討論分區(qū),后面,我會(huì)談及子分區(qū)統(tǒng)計(jì)信息。
Oracle在分區(qū)和表級(jí)是如何管理統(tǒng)計(jì)信息的?
目前,我們已經(jīng)創(chuàng)建了所需的分區(qū)和表級(jí)的統(tǒng)計(jì)信息。Oracle是如何收集它們的?表級(jí)統(tǒng)計(jì)信息可以從分區(qū)級(jí)統(tǒng)計(jì)信息上推導(dǎo)出來(lái)嗎?
我們可以非常容易地從單獨(dú)分區(qū)中推導(dǎo)出全局的NUM_ROWS;簡(jiǎn)單的合計(jì)各個(gè)分區(qū)的NUM_ROWS(比如示例中的:600+550=1150)即可。不幸的是,對(duì)于唯一值數(shù)量(NDV要)就不是那么簡(jiǎn)單了。在上面的示例中,在全局層級(jí)上,SALE_TYPE的NDV(55),并不能通過(guò)在分區(qū)層級(jí)上的值30和50來(lái)計(jì)算。信息是不充分的:基礎(chǔ)值30和50并沒(méi)有告訴我們SALE_TYPE在Q1和Q2中的重疊情況。設(shè)想兩張相同的表,TAB1和TAB2在Q1和Q2分區(qū)上包含有不同的SALE_TYPE值:
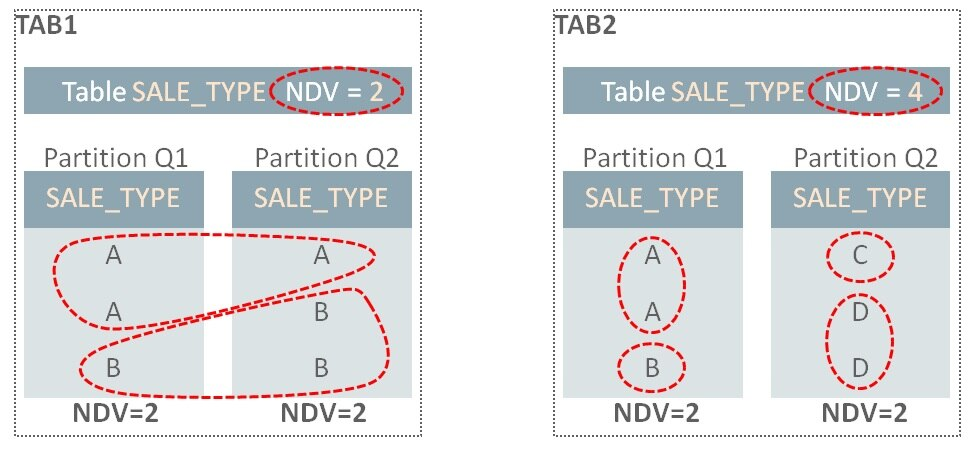
在TAB1中,Q1分區(qū)上SALE_TYPE有值A(chǔ)和值B,因此NDS是2.Q2上有同樣的值A(chǔ)和值B,所以整個(gè)表的NDV是2。而在TAB2中,在Q1和Q2中并沒(méi)有重疊的值,因此,盡管分區(qū)上的NDV也是2,但整個(gè)NDV是4。
為了計(jì)算全局NDV值,數(shù)據(jù)庫(kù)需要檢測(cè)所有表分區(qū)(假設(shè)我們并沒(méi)有其它信息可用)。當(dāng)表變大后,這將是非常耗時(shí),特別是如果有成百上千個(gè)分區(qū)時(shí)。
來(lái)自Synopses的拯救
Oracle數(shù)據(jù)庫(kù)是如何解決這個(gè)問(wèn)題的呢?可以配置表在統(tǒng)計(jì)信息收集過(guò)程中,為每一個(gè)分區(qū)收集額外的信息。每個(gè)表分區(qū)擁有一個(gè)稱之為synopsis的新的數(shù)據(jù)結(jié)構(gòu)。匯集到一起,稱之為synopses。
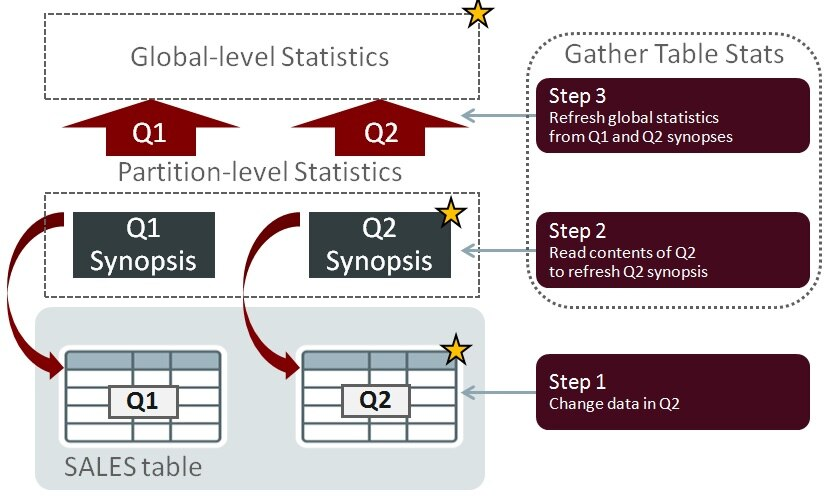
如果某個(gè)分區(qū)的數(shù)據(jù)變化了,重新計(jì)算全局NDV值時(shí),不需要讀取所有其它分區(qū)的內(nèi)容。在下面的例子中,Q2中的數(shù)據(jù)已經(jīng)發(fā)生了變化(星標(biāo)表示變化發(fā)生的位置)。當(dāng)重新收集統(tǒng)計(jì)信息時(shí),因?yàn)榭梢杂肣1和Q2的synopses所包含的信息來(lái)替代,所以,不需要讀取Q1分區(qū)中的內(nèi)容:
Synopses允許數(shù)據(jù)庫(kù)以可度量的方式,精準(zhǔn)地維護(hù)表的統(tǒng)計(jì)信息:當(dāng)表尺寸增長(zhǎng)和分區(qū)數(shù)量增加時(shí),這個(gè)功能所帶來(lái)的性能收益會(huì)愈加明顯。
Synopses 的存儲(chǔ)
Synopses由數(shù)據(jù)庫(kù)自動(dòng)維護(hù)。有關(guān)每個(gè)表分區(qū)中存儲(chǔ)的數(shù)據(jù)的附加信息,保存在SYSAUX表空間中。對(duì)于有較多的列和高NDV值的表,其數(shù)據(jù)量可能會(huì)變得很大,因此,應(yīng)該對(duì)SYSAUX進(jìn)行空間使用率的監(jiān)控。統(tǒng)計(jì)信息收集過(guò)程必須維護(hù)synopsis信息,因而這些操作會(huì)帶來(lái)額外的性能開(kāi)銷。我會(huì)在貼子3中繼續(xù)討論這個(gè)話題。
陳舊度與DML變化
如果統(tǒng)計(jì)信息沒(méi)有被周期性的收集,并且?guī)熘械臄?shù)據(jù)總是在變化中,那么統(tǒng)計(jì)信息會(huì)過(guò)期并且潛在地變?yōu)殛惻f和失準(zhǔn)。為了產(chǎn)生好的SQL執(zhí)行計(jì)劃,統(tǒng)計(jì)信息需要精準(zhǔn),因而數(shù)據(jù)庫(kù)必須檢測(cè)到何時(shí)他們會(huì)陳舊。通過(guò)跟蹤表、分區(qū)和子分區(qū)上發(fā)生的insert、update和delete這些DML操作的行數(shù)來(lái)做到這一點(diǎn)。一旦DML操作的行數(shù)超過(guò)了特定的閾值,則表,分區(qū)和子分區(qū)的統(tǒng)計(jì)信息狀態(tài)就變?yōu)殛惻f。
默認(rèn)情況下,增量維護(hù)不會(huì)使用陳舊狀態(tài)來(lái)決定何時(shí)更新統(tǒng)計(jì)信息。該場(chǎng)景在早前有關(guān)Oracle database 11g的博文中有所介紹。哪怕分區(qū)或子分區(qū)只面臨單行的DML操作,synopsis也會(huì)給予適當(dāng)?shù)母拢膕ynopses中重新計(jì)算全局統(tǒng)計(jì)信息。該行為在Oracle Database 12c可以被改變,允許你使用陳舊度閾值來(lái)決定何時(shí)重新計(jì)算增量統(tǒng)計(jì)信息。這一點(diǎn),在下面的“陳舊度與DML閾值”部分介紹
實(shí)現(xiàn)
啟用synopses
為了啟用synopses的創(chuàng)建,表必須被配置為使用增量維護(hù)。該功能通過(guò)使用DBMS_STATS中的,稱之為’INCREMENTAL’的偏好參數(shù)來(lái)切換。比如:
EXEC dbms_stats.set_table_prefs(null,'SALES','INCREMENTAL','TRUE')
增量維護(hù)已啟用的檢查
可以使用下面的代碼來(lái)檢查 DBMS_STATS的偏好參數(shù)值:
SELECT dbms_stats.get_prefs(pname=>'INCREMENTAL',
                            tabname=>'SALES')
FROM dual;
陳舊度和DML閾值
如上所述,當(dāng)數(shù)據(jù)上產(chǎn)生的變化量超過(guò)一定的值時(shí),優(yōu)化器統(tǒng)計(jì)信息被認(rèn)為是陳舊的。這個(gè)值被表示為表、分區(qū)或子分區(qū)中行的變化百分比,并通過(guò)DBMS_STATS中稱為STALE_PERCENT的偏好參數(shù)來(lái)設(shè)置。陳舊百分比的默認(rèn)值是10。例如,一個(gè)包括100行的分區(qū),如果被更新、增加或刪除超過(guò)10行,就會(huì)被認(rèn)為陳舊。
以下是設(shè)置和觀察該偏好值的示例:
EXEC dbms_stats.set_table_prefs(null, 'SALES', 'STALE_PERCENT','5')

select dbms_stats.get_prefs('STALE_PERCENT',null,'SALES') from dual;
檢查表或分區(qū)是否已被標(biāo)注記為陳舊也很簡(jiǎn)單:
select partition_name,
       subpartition_name,
       stale_stats               /* YES or NO */
from   dba_tab_statistics
where  table_name = 'SALES';
數(shù)據(jù)庫(kù)跟蹤DML操作,來(lái)度量何時(shí)數(shù)據(jù)的變化已經(jīng)超出了表上的陳舊度閾值。如果你想觀察這個(gè)信息,請(qǐng)記住統(tǒng)計(jì)信息是概略的,是周期性的被刷了到磁盤(pán)上。如果你想在測(cè)試期間看到即時(shí)的變化,你需要手動(dòng)刷新它們(需要擁有’ANALYZE ANY’的系統(tǒng)權(quán)限), 類似這樣:
EXEC dbms_stats.flush_database_monitoring_info

select  *
from    dba_tab_modifications
where   table_name = 'SALES';
請(qǐng)注意,如果你在Oracle Database 11g中使用增量統(tǒng)計(jì)信息,在分區(qū)或子分區(qū)上的單行的DML操作,也會(huì)導(dǎo)致統(tǒng)計(jì)信息的刷新–即便這并不會(huì)使其陳舊。換句話說(shuō),我們可能在包含1百萬(wàn)行的分區(qū)上更新了1行。分區(qū)并不會(huì)被標(biāo)記為陳舊(如果我們假設(shè)陳舊度閾值為10%),但是最新的統(tǒng)計(jì)信息還是會(huì)被收集。Oracle Database 12c默認(rèn)情況下是同樣的行為,但是該版本給了你一個(gè)選項(xiàng),允許在分區(qū)或子分區(qū)上發(fā)生多行變化時(shí),才會(huì)增量刷新。你可以通過(guò)改變DBMS_STATS的偏好參數(shù)INCREMENTAL_STALENESS從默認(rèn)值(NULL)為’USE_STALE_PERCENT’來(lái)啟用。 例如:
exec dbms_stats.set_global_prefs('INCREMENTAL_STALENESS', 'USE_STALE_PERCENT')
一旦設(shè)置了這一個(gè)偏好參數(shù),STALE_PERCENT值將被用來(lái)定義增量維護(hù)中的DML變化閾值。換句話說(shuō),如果分區(qū)的DML變化量低于STALE_PERCENT閾值,則不會(huì)收集該分區(qū)的統(tǒng)計(jì)信息。
鎖定統(tǒng)計(jì)信息
只要被鎖定的分區(qū)上沒(méi)有DML發(fā)生,增量統(tǒng)計(jì)信息就可以與分區(qū)統(tǒng)計(jì)信息鎖定一同工作。然而,如果在鎖定的分區(qū)上會(huì)發(fā)生DML,那么我們將不再能保證來(lái)自于鎖定統(tǒng)計(jì)信息的全局統(tǒng)計(jì)信息是準(zhǔn)確的。故而,收集全局統(tǒng)計(jì)信息時(shí),數(shù)據(jù)庫(kù)會(huì)退回到非增量的方法。但是,如果出于某種原因,你必須鎖定分區(qū)級(jí)的統(tǒng)計(jì)信息,還仍要使用增量統(tǒng)計(jì)信息收集的優(yōu)點(diǎn),你可以設(shè)置偏好參數(shù)’INCREMENTAL_STALENESS’包含‘USE_LOCKED_STATS’。一旦設(shè)置了,只要鎖定的分區(qū)/子分區(qū)統(tǒng)計(jì)信息有synopses,將無(wú)視DML變化,也不會(huì)認(rèn)為是陳舊的
注:‘INCREMENTAL_STALENESS’可以接受多個(gè)值,比如:
BEGIN
   dbms_stats.set_table_prefs(
      ownname=>null,
      tabname=>'SALES',
      pname =>'INCREMENTAL_STALENESS',
      pvalue=>'USE_STALE_PERCENT, USE_LOCKED_STATS');
END;
/
陳舊度的檢查
你可以非常簡(jiǎn)單地使用統(tǒng)計(jì)信息視圖來(lái)檢查表/分區(qū)/子分區(qū)的陳舊度,例如:
EXEC dbms_stats.flush_database_monitoring_info

select partition_name,subpartition_name,stale_stats
from   dba_tab_statistics
where  table_name = 'SALES'
order by partition_position, subpartition_position;
數(shù)據(jù)庫(kù)監(jiān)控?cái)?shù)據(jù)被用于識(shí)別陳舊的統(tǒng)計(jì)信息,故而,如果要進(jìn)行測(cè)試,并且希望立即了解數(shù)據(jù)變化對(duì)陳舊狀態(tài)的影響,你需要調(diào)用FLUSH_DATABASE_MONITORING_INFO。
Synopses的檢查
Oracle支持網(wǎng)站維護(hù)的文檔 Note 1953961.1 中,包含有列出帶有synopses的對(duì)象的查詢語(yǔ)句。
收集統(tǒng)計(jì)信息
如何在使用增量維護(hù)的表上收集其統(tǒng)計(jì)信息呢?簡(jiǎn)單地說(shuō),使用下面的存儲(chǔ)過(guò)程,讓Oracle Database確定如何做最好:
EXEC dbms_stats.gather_table_stats(null,'SALES')
或者
EXEC dbms_stats.gather_schema_stats(…)
或者更好的是
EXEC dbms_stats.gather_database_stats()
對(duì)于DBMS_STATS.GATHER…類存儲(chǔ)過(guò)程,你必須設(shè)置ESTIMATE_PERCENT為AUTO_SAMPLE_SIZE。由于這是默認(rèn)值,所以,這也是上面的示例中使用的值,除非你修改了它。如果你為ESTIMATE_PERCENT使用了一個(gè)百分比值,增量維護(hù)將不會(huì)生效。
在數(shù)據(jù)無(wú)變化時(shí)重新收集統(tǒng)計(jì)信息
你可能時(shí)不常發(fā)現(xiàn)沒(méi)有任何DML變化的分區(qū)的統(tǒng)計(jì)信息被收集了。為什么呢?有這樣一些原因:
1、 統(tǒng)計(jì)信息被解鎖了。
2、 表列的使用發(fā)生了改變 (下面會(huì)解釋)。
3、 添加了新列。這包括因創(chuàng)建諸如列組,列表達(dá)式的擴(kuò)展統(tǒng)計(jì)信息而創(chuàng)建的隱藏列。
4、 Synopses未和列統(tǒng)計(jì)信息同步。這可能是因?yàn)槟阍赥1時(shí)刻,以增量模式收集了統(tǒng)計(jì)信息,然后你關(guān)閉了增量并重新收集統(tǒng)計(jì)信息在T2時(shí)刻。synopses的時(shí)間戳T1就與基本列統(tǒng)計(jì)信息中的時(shí)間戳2失去了同步。
5、 不太常見(jiàn)的情況是使用delete_column_statistics刪除列統(tǒng)計(jì)信息。
原因2有一些隱晦。數(shù)據(jù)庫(kù)會(huì)跟蹤查詢謂詞中出現(xiàn)列是如何使用,并存儲(chǔ)這一信息到數(shù)據(jù)字典 (sys.col_usage$). 數(shù)據(jù)庫(kù)使用該信息幫助找出會(huì)從直方圖histogram 受益,改進(jìn)查詢基數(shù)的評(píng)估等。其結(jié)果會(huì)影響SQL執(zhí)行計(jì)劃。如果列的使用改變了,而且你設(shè)置METHOD_OPT 帶有 'SIZE AUTO’值,那么數(shù)據(jù)庫(kù)可能選擇重新收集統(tǒng)計(jì)信息并創(chuàng)建一個(gè)新的直方圖。這種情況很少見(jiàn),但我知道有些客戶,會(huì)通過(guò)指定收集全部(列)的直方圖來(lái)防止這種情況發(fā)生的可能:
dbms_stats.set_table_prefs
   (null, 'SALES',
   'METHOD_OPT','FOR ALL COLUMNS SIZE 1 FOR COLUMNS SIZE 254 CUST_ID');

dbms_stats.set_table_prefs
   (null, 'SALES',
   'METHOD_OPT','FOR ALL COLUMNS SIZE 1');
如果你是這么做的,那么你應(yīng)該請(qǐng)求并應(yīng)用補(bǔ)丁31464491 。 當(dāng)你通過(guò)DBMS_STATS的偏好參數(shù)來(lái)設(shè)置METHOD_OPT時(shí),你需要確保直方圖的檢查操作是可靠的 (否則分區(qū)統(tǒng)計(jì)可能會(huì)非常頻繁的重新收集)。如果你對(duì)相關(guān)表并不是使用偏好參數(shù)來(lái)設(shè)置的,而是使用全局DBMS_STATS 的METHOD_OPT設(shè)置來(lái)關(guān)閉直方圖的話 ,則不需要該補(bǔ)丁。
本地分區(qū)索引統(tǒng)計(jì)信息
對(duì)于本地分區(qū)索引統(tǒng)計(jì)信息,我們首先檢查對(duì)應(yīng)表分區(qū)或子分區(qū)。如果表分區(qū)(子分區(qū))有新的統(tǒng)計(jì)信息并且索引的統(tǒng)計(jì)信息已經(jīng)在表分區(qū)(子分區(qū))統(tǒng)計(jì)信息收集之后收集了,那么應(yīng)該認(rèn)為他們是新的,是不需要重新收集的。
復(fù)合分區(qū)表
子分區(qū)級(jí)上的統(tǒng)計(jì)信息被數(shù)據(jù)庫(kù)收集并存儲(chǔ),但要注意,synopses僅在分區(qū)級(jí)創(chuàng)建。這意味著如果子分區(qū)的統(tǒng)計(jì)信息因數(shù)據(jù)變化而陳舊,那么父分區(qū)統(tǒng)計(jì)信息(和synopses)將會(huì)通過(guò)檢查其下所有子分區(qū)的方式來(lái)刷新。數(shù)據(jù)庫(kù)只會(huì)在子分區(qū)級(jí)別,重新收集那些陳舊的子分區(qū)。
更多信息
在 Database SQL Tuning Guide中有關(guān)此主題的更多信息。
原文鏈接:https://blogs.oracle.com/optimizer/post/efficient-statistics-maintenance-for-partitioned-tables-using-incremental-statistics-part-1
原文標(biāo)題:
Efficient Statistics Maintenance for Partitioned Tables Using Incremental Statistics – Part 1
原文作者:Nigel Bayliss
原文內(nèi)容:
Efficient Statistics Maintenance for Partitioned Tables Using Incremental Statistics – Part 1
Nigel Bayliss
Product Manager
Introduction
It’s common to have multi-terabyte partitioned tables in an Oracle database these days. If you are not there yet but you’re heading that way, then you need to know about how to maintain statistics on large tables. I will cover this in a series of posts as follows:
- Part 1 (this post) – Concepts and implementation
- Part 2 – Incremental statistics and partition exchange loading
- Part 3 – New to Oracle Database 12c Release 2
There are some additional details and some overlap with an earlier Optimizer blog post, so you should check that out too.
Concepts
What statistics are there on partitioned tables?
Consider a partitioned table called SALES that has date-range partitions for financial quarters 1 and 2 (Q1 and Q2). The partition key is on the column QUARTER. The database gathers statistics for individual partitions so that cardinality can be estimated for queries that are pruned to a single partition. These are called partition-level statistics. To illustrate this with an example, I’m going to consider just a couple of statistics and ignore the others. The number of rows in Q1 and Q2 are 600 and 550 respectively. The number of distinct values (NDVs) for SALE_TYPE in Q1 is 30 and Q2 it’s 50:
Partition-level statistics
When a query is compiled, if the Oracle Optimizer determines that it will need to access a single partition (using partition pruning, for example) then the statistics at the partition-level will be enough to help determine the execution plan. Here’s a query that reads Q1 only:
SELECT SUM(amount) FROM sales WHERE quarter = 'Q1' AND sale_type = 'DIRECT';
If the Optimizer determines at compile-time that a query has the potential to access more than one partition, then individual partition statistics are not enough. In the next example, the query needs to access more than one partition:
SELECT SUM(amount) FROM sales
WHERE  sale_type = 'DIRECT';
For queries that might access multiple partitions, the Optimizer must consider statistics at the table level. These statistics are known as global-level statistics:
Global-level statistics
You will know that the Oracle database can further subdivide partitions into subpartitions; a feature known as composite partitioning. For now I’m only going to talk about partitions, and later on I’ll say something about subpartition statistics.
How does Oracle manage statistics information at the partition and table level?
Now that we have established the need for both partition and table level statistics, how does Oracle collect them? Can the table-level statistics be derived from partition-level statistics?
It is very easy to derive NUM_ROWS at the global level from individual partitions; simply sum NUM_ROWS for each partition (e.g. 600+550=1150 in the example). Unfortunately, it isn’t that simple for the number of distinct values (denoted as NDVs). In the example above, the NDV for SALE_TYPE at the global level (55) can’t be calculated using the values 30 and 50 at the partition-level. There’s insufficient information: the basic values 30 and 50 don’t tell us anything about the overlap of SALE_TYPE values in Q1 and Q2. Consider two identical tables, TAB1 and TAB2 that contain difference SALE_TYPE values in Q1 and Q2 partitions:
NDV
In TAB1, the Q1 partition has SALE_TYPE values A and B, so the NDV is 2. Q2 has the same values, A and B, so the overall table NDV is 2. In the TAB2 case, there is no overlap in values between Q1 and Q1, so even though the partition NDV values are also 2, the overall NDV is 4.
To calculate the global-level NDV value, the database must examine all table partitions (assuming that we don’t have some additional information at our disposal). This can become very time-consuming as tables grow large, especially if there are hundreds or thousands of partitions.
Synopses to the rescue
How does the Oracle Database resolve this problem? Tables can be configured to instruct the statistics gathering procedures to store additional information about each individual partition. Each table partition has a new data structure called a synopsis. Collectively, these structures are called synopses.
If data changes in one partition, there is no need to read to contents of all other partitions when recalculating the global-level NDV values. In the following example, change has been made to the data in Q2 (the star symbols indicate where change is occurring). When statistics are re-gathered, there is no need to read the contents of the Q1 partition because the information contained in the Q1 and Q2 synopses can be used instead:
Gathering statistics
Synopses allow the database to maintain accurate table statistics in a scalable manner: as tables grow in size and the number of partitions increases, the performance benefit of this feature will become more apparent.
Synopses storage
Synopses are maintained automatically by the database. They store additional information in the SYSAUX tablespace about the data stored in every table partition. For tables with large numbers of columns and high NDVs, the amount of data can become large so space usage in SYSAUX should be monitored. Statistics gathering procedures must maintain the synopsis information so this can add a performance overhead for some operations. I will return to this topic in Part 3 of this series.
Staleness and DML Change
If statistics are not gathered periodically and if the data in the database changes over time, then statistics will be out of date and potentially stale and inaccurate. Statistics need to be accurate to generate good SQL execution plans so the database must detect when they are stale. It does this by tracking the number of DML row insert, update and delete operations for tables, partitions and sub-partitions. Once the number of DML operations exceeds a certain threshold the statistics status for the table, partition or sub-partition is changed to stale.
By default, incremental maintenance does not use the staleness status to decide when to update statistics. This scenario is covered in an earlier blog post for Oracle Database 11g. If a partition or sub-partition is subject to even a single DML operation, statistics will be re-gathered, the appropriate synopsis will be updated and the global-level statistics will be re-calculated from the synopses. This behavior can be changed in Oracle Database 12c, allowing you to use the staleness threshold to define when incremental statistics will be re-calculated. This is covered in Staleness and DML thresholds, below.
Implementation
Enabling synopses
To enable the creation of synopses, a table must be configured to use incremental maintenance. This feature is switched on using a DBMS_STATS preference called ‘INCREMENTAL’. For example:
EXEC dbms_stats.set_table_prefs(null,'SALES','INCREMENTAL','TRUE')
Checking that incremental maintenance is enabled
The value of the DBMS_STATS preference can be checked as follows:
SELECT dbms_stats.get_prefs(pname=>'INCREMENTAL',
                            tabname=>'SALES')
FROM dual;
Staleness and DML thresholds
As mentioned above, Optimizer statistics are considered stale when the number of changes made to data exceeds a certain threshold. This threshold is expressed as a percentage of row changes for a table, partition or subpartition and is set using a DBMS_STATS preference called STALE_PERCENT. The default value for stale percent is 10 so, for example, a partition containing 100 rows would be marked stale if more than 10 rows are updated, added or deleted. Here is an example of setting and inspecting the preference:
EXEC dbms_stats.set_table_prefs(null, 'SALES', 'STALE_PERCENT','5')

select dbms_stats.get_prefs('STALE_PERCENT',null,'SALES') from dual;
It is easy to check if a table or partition has been marked as stale:
select partition_name,
       subpartition_name,
       stale_stats               /* YES or NO */
from   dba_tab_statistics
where  table_name = 'SALES';
The database tracks DML operations to measure when data change has caused a table to exceed its staleness threshold. If you want to take a look at this information, bear in mind that the statistics are approximate and they are autmatically flushed to disk periodically. If you want to see the figures change immediately during your tests then you will need to flush them manually (you must have ‘ANALYZE ANY’ system privilege), like this:
EXEC dbms_stats.flush_database_monitoring_info

select  *
from    dba_tab_modifications
where   table_name = 'SALES';
Remember that if you are using incremental statistics in Oracle Database 11g, a single DML operation on a partition or sub-partition will make it a target for a statistics refresh - even if it is not marked stale. In other words, we might update one row in a partition containing 1 million rows. The partition won’t be marked state (if we assume a 10% staleness threshold) but fresh statistics will be gathered. Oracle Database 12c exhibits the same behavior by default, but this release gives you the option to allow multiple DML changes to occur against a partition or sub-partition before it is a target for incremental refresh. You can enable this behavior by changing the DBMS_STATS preference INCREMENTAL_STALENESS from its default value (NULL) to ‘USE_STALE_PERCENT’. For example:
exec dbms_stats.set_global_prefs('INCREMENTAL_STALENESS', 'USE_STALE_PERCENT')
Once this preference is set, a table’s STALE_PERCENT value will be used to define the threshold of DML change in the context of incremental maintenance. In other words, statistics will not be re-gathered for a partition if the number of DML changes is below the STALE_PERCENT threshold.
Locking statistics
Incremental statistics does work with locked partitions statistics as long as no DML occurs on the locked partitions. However, if DML does occurs on the locked partitions then we can no longer guarantee that the global statistics built from the locked statistics will be accurate so the database will fall back to using the non-incremental approach when gathering global statistics. However, if for some reason you must lock the partition level statistics and still want to take advantage of incremental statistics gathering, you can set the ‘INCREMENTAL_STALENESS’ preference to include ‘USE_LOCKED_STATS’. Once set, the locked partitions/subpartitions stats are NOT considered as stale as long as they have synopses, regardless of DML changes.
Note that ‘INCREMENTAL_STALENESS’ accepts multiple values, such as:
BEGIN
   dbms_stats.set_table_prefs(
      ownname=>null,
      tabname=>'SALES',
      pname =>'INCREMENTAL_STALENESS',
      pvalue=>'USE_STALE_PERCENT, USE_LOCKED_STATS');
END;
/
Checking for staleness
You can check for table/partition/subpartition staleness very easily using the statistics views. For example:
EXEC dbms_stats.flush_database_monitoring_info

select partition_name,subpartition_name,stale_stats
from   dba_tab_statistics
where  table_name = 'SALES'
order by partition_position, subpartition_position;
Database monitoring information is used identify stale statistics, so you’ll need to call FLUSH_DATABASE_MONITORING_INFO if you’re testing this out and you want to see immediately how the staleness status is affected by data change.
Checking for Synopses
Oracle Support maintains Note 1953961.1 which includes a query that lists objects with synopses.
Gathering statistics
How do you gather statistics on a table using incremental maintenance? Keep things simple! Let the Oracle Database work out how best to do it. Use these procedures:
                       EXEC dbms_stats.gather_table_stats(null,'SALES')
or                     EXEC dbms_stats.gather_schema_stats(…)
or, even better        EXEC dbms_stats.gather_database_stats()
For the DBMS_STATS.GATHER… procedures you must use ESTIMATE_PERCENT set to AUTO_SAMPLE_SIZE. Since this is the default, then that is what will be used in the examples above unless you have overriden it. If you use a percentage value for ESTIMATE_PERCENT, incremental maintenance will not kick in.
Regathering statistics when data hasn’t changed
From time-to-time you might notice that statistics are gathered on partitions that have not been subject to any DML changes. Why is this? There are a number of reasons:
1. Statistics have been unlocked.
2. Table column usage has changed (this is explained below).
3. New columns are added. This includes hidden columns created from statistics extensions such as column groups, column expressions.
4. Synopses are not in sync with the column statistics. It is possible that you have gathered statistics in incremental mode at time T1. Then you disable incremental and regather statistics at time T2. Then the synopses’ timestamp T1 is out of sync with the basic column statistics’ timestamp T2.
5. Unusual cases such as column statistics have been deleted using delete_column_statistics.
Bullet point “2” has some implications. The database tracks how columns are used in query predicates and stores this information in the data dictionary (sys.col_usage$). It uses this information to help it figure out which columns will benefit from a histogram to improve query cardinality estimates and, as a result, improve SQL execution plans. If column usage changes and you are using METHOD_OPT with ‘SIZE AUTO’, then the database might choose to re-gather statistics and create a new histogram. It will be rare event and will eventually cease, but I know that some customers like to prevent this possibility by specifying histograms fully:
dbms_stats.set_table_prefs
   (null, 'SALES',
   'METHOD_OPT','FOR ALL COLUMNS SIZE 1 FOR COLUMNS SIZE 254 CUST_ID');

dbms_stats.set_table_prefs
   (null, 'SALES',
   'METHOD_OPT','FOR ALL COLUMNS SIZE 1');
If you do this, then you should request and apply patch 31464491 for your platform. This is necessary to ensure that the histogram check operates reliably when METHOD_OPT is set via a DBMS_STATS table preference (otherwise partition statistics may be regathered too frequently).The patch is not required if you are not using a table preference for the relevant table, but have instead disabled histograms using a global DBMS_STATS METHOD_OPT setting.
Locally partitioned index statistics
For locally partitioned index statistics, we first check their corresponding table partitions (or subpartitions). If the table (sub)partitions have fresh statistics and the index statistics have been gathered after the table (sub)partition-level statistics, then they are considered fresh and their statistics are not regathered.
Composite partitioned tables
Statistics at the subpartition level are gathered and stored by the database, but note that synopses are created at the partition level only. This means that if the statistics for a subpartition become stale due to data changes, then the statistics (and synopsis) for the parent partition will be refreshed by examining all of its subpartitions. The database only regathers subpartition-level statistics on subpartitions that are stale.
More information
There is more on this topic in the Database SQL Tuning Guide.
